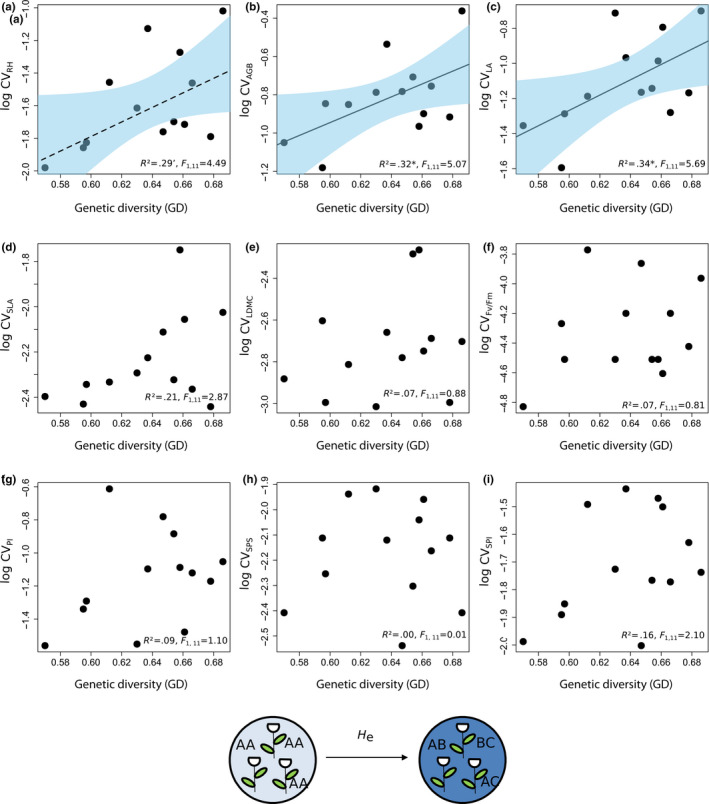
FIGURE 5.

Relationships between coefficient of variation of particular traits (CVtraits) and genetic diversity (GD, He) in 13 Trifolium montanum populations (n = 255 individuals) of Central Europe. 95%‐confidence intervals are drawn for all (marginal) significant relationships. Dotted regression lines represent only marginal significant relationships (.05 < p < .1). See Table S1 for detailed model statistics, and Table 2 for abbreviations. Significance levels: *p < .05 and ‘=.1 > p> .05
