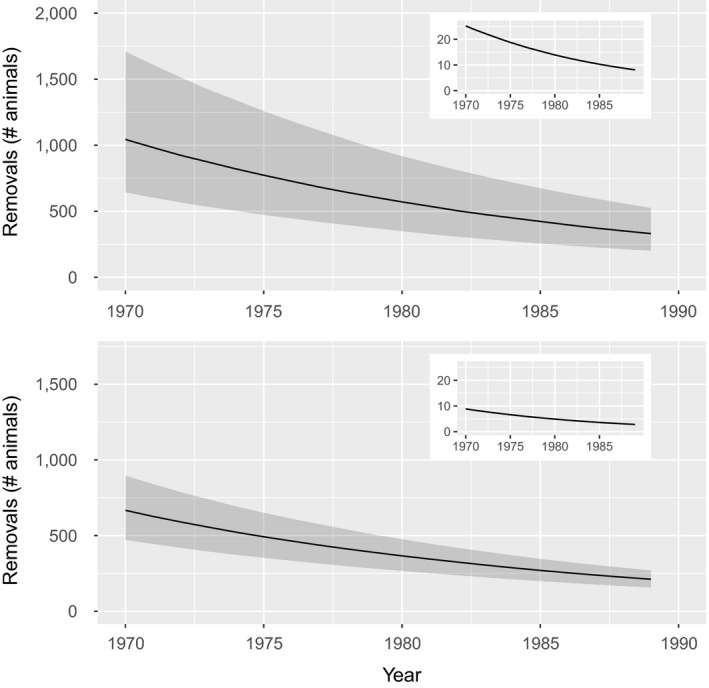
FIGURE 2.

Predicted juvenile removals by year (main plots) relative to the Potential Biological Removals (PBR) reference point (inset plots) for the short life history (top panel) and long life history (bottom panel). Solid lines represent median values and the gray shading represents the 80th percentile. Note that the total decline rate as well as the years over which it occurred correspond to Curtis et al. (2014)
