FIGURE 3.

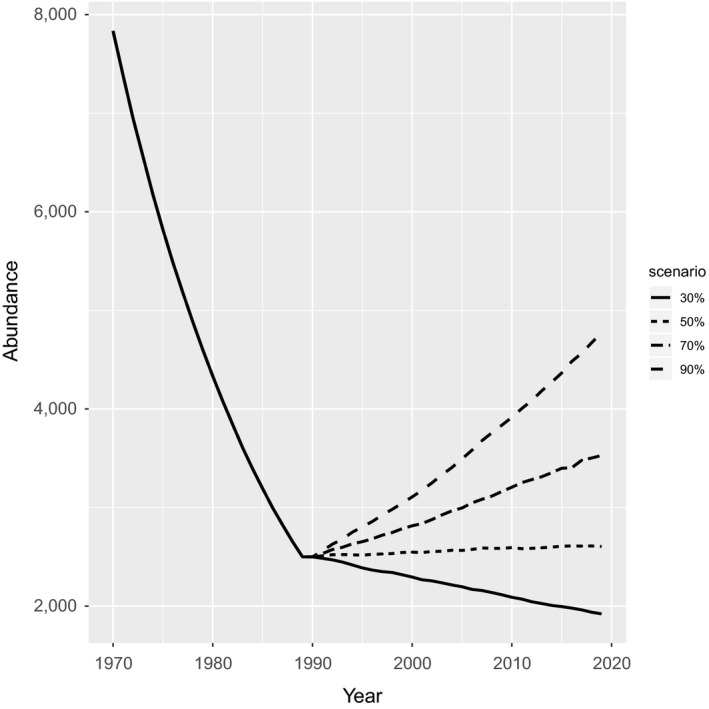
Historical population decline (1970–1989) and subsequent predicted population trajectory (1990–2019) under a 30%, 50%, 70%, or 90% reduction in fishing mortality for the long life history scenario

Historical population decline (1970–1989) and subsequent predicted population trajectory (1990–2019) under a 30%, 50%, 70%, or 90% reduction in fishing mortality for the long life history scenario