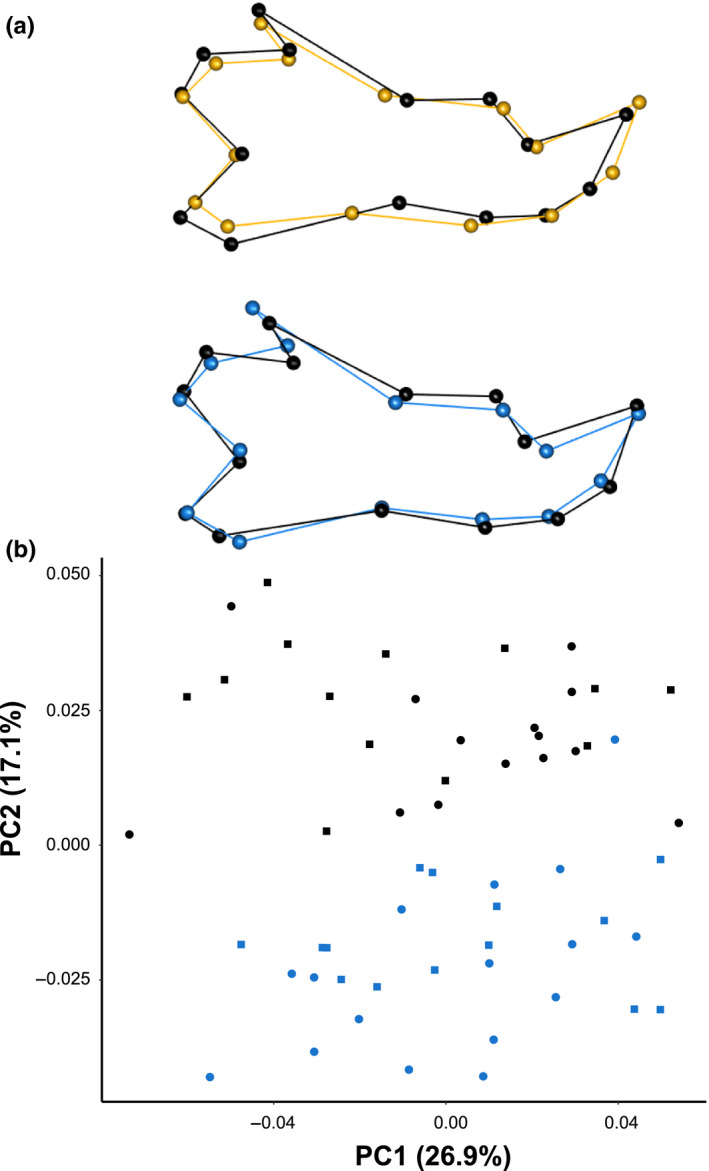
FIGURE 2.

Changes in brown rat mandible shape along principal component (PC) axes representing (a) PC1 and (b) PC2. Wireframe models show the shape differences between PC score minima (color, gold or blue) and maxima (black). (c) PCA of mandible shape of brown rats from Manhattan, USA. Color represents time periods (black—1890s; blue—2010s) and shape represents sex (circles—females; squares—males). PC1 represents the static allometric axis, with larger animals on the right
