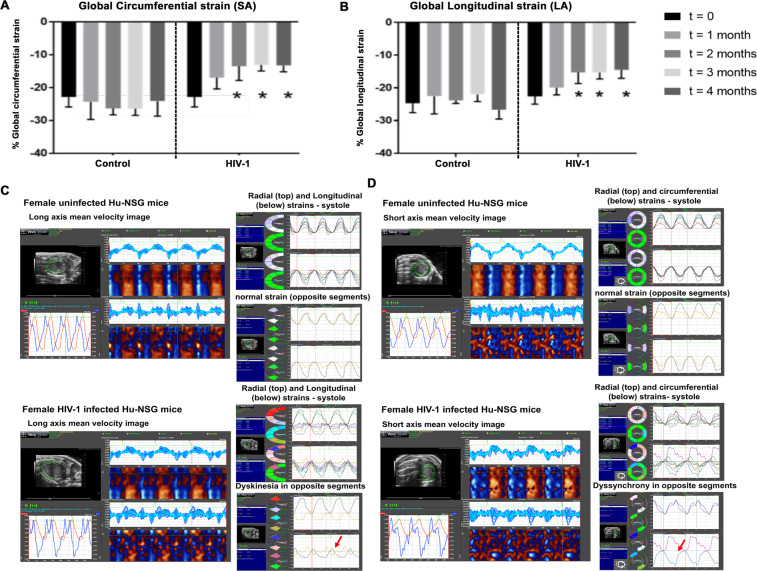
Figure 5.
Changes in global longitudinal and circumferential strains over a 16-week period post-HIV-1 infection in Hu-NSG Mice. (A,B) Shows mean global longitudinal and circumferential strains in Hu-NSG mice prior to (t = 0), and 4, 8, 12, and 16 weeks after injection with saline or infection with HIV-1. Data shown are mean ± SEM for n = 8 uninfected Hu-NSG mice (3 males and 5 females) and n = 16 for HIV-1 infected Hu-NSG mice (4 males and 12 females). * denote significantly different from t = 0 weeks (p < 0.05) within the group. (C,D) Shows long and short axes velocities during three to four consecutive cardiac cycles (left), and radial and longitudinal strain in six and two opposite segments (right) from an uninfected female and a HIV-1-infected female Hu-NSG mouse that exhibits dyskinesia (expansion of a wall segment during systole, (C). right panel, red arrow) and dyssynchrony (opposite walls moving in counter directions), (D), right panel, red arrow after 12 weeks of infection. Images in 5C and 5D are representative of n = 6 uninfected and HIV-1 infected Hu-NSG mice (4 females and 2 males). White scale bar at the bottom indicates 200 μm.

