
FIGURE 2.
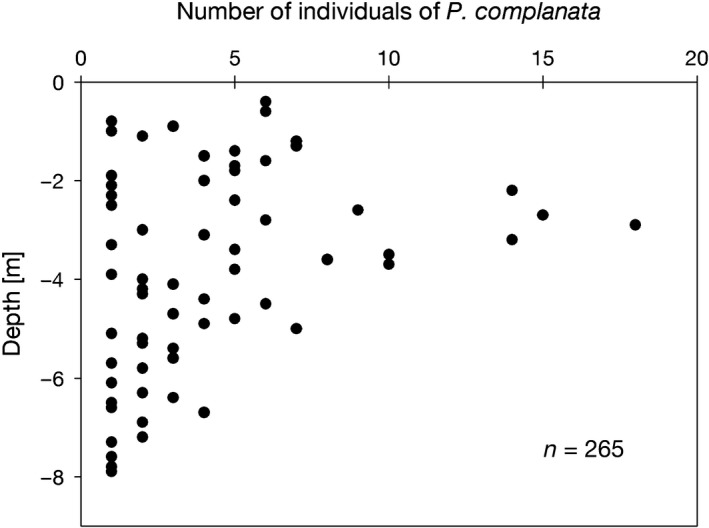
Depth distribution of Pseudanodonta complanata in the main study area. Number of individuals of P. complanata represents the number of individuals collected at specified depths over the study sites S1–S4
Official websites use .gov
A
.gov website belongs to an official
government organization in the United States.
Secure .gov websites use HTTPS
A lock (
) or https:// means you've safely
connected to the .gov website. Share sensitive
information only on official, secure websites.
Depth distribution of Pseudanodonta complanata in the main study area. Number of individuals of P. complanata represents the number of individuals collected at specified depths over the study sites S1–S4