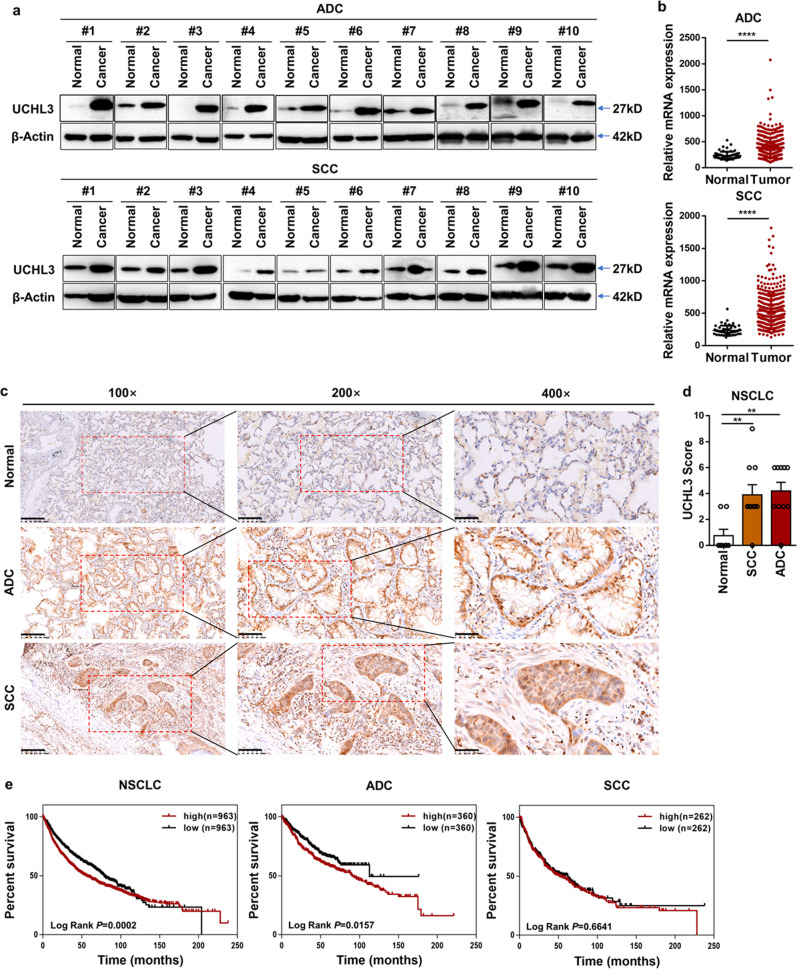
Fig. 1.
UCHL3 is upregulated and associated with poor survival in NSCLC. a Western blot analysis showed increased UCHL3 protein expression in 20 paired lung cancer (ADC and SCC) tissue samples relative to adjacent normal lung tissue samples. b TCGA analysis of UCHL3 mRNA expression in ADC (Normal n = 58; Tumor n = 488) and SCC (Normal n = 50; Tumor n = 409) lung cancer samples compared to normal lung samples. Each dot represents a sample. Data are shown as the mean ± SD; ****p < 0.0001. c IHC analysis showed increased UCHL3 expression levels in lung cancer (magnification, ×100 scale bar = 200 μm; magnification, ×200 scale bar = 100 μm; magnification, ×400 scale bar = 50 μm). d IHC scores indicating UCHL3 expression levels in lung cancer tissues versus normal tissues (Normal n = 8; SCC n = 10; ADC n = 10). Data are shown as the mean ± SD; **p < 0.01. e Kaplan–Meier curves showing overall survival rates associated with UCHL3 expression in lung cancer. NSCLC p = 0.0002; ADC p = 0.0157; SCC p = 0.6641; tested by log-rank test. Two-tailed Student’s t-test (b) or one-way ANOVA with multiple comparisons (d)

