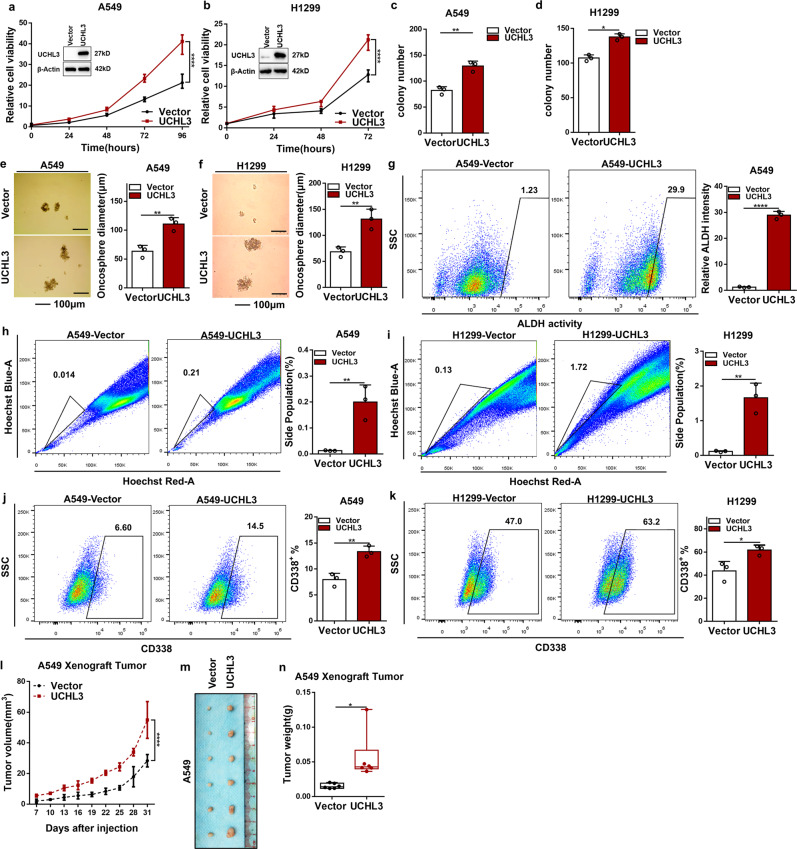
Fig. 2.
Overexpression of UCHL3 promoted cell growth, colony formation, tumor formation, and tumor stem-like properties. a, b The MTS assay was used to assess cell viability in A549 (a) and H1299 (b) cells stably overexpressing UCHL3 (n=5). Data are shown as the mean ± SD; ****p < 0.0001. c, d A colony formation assay in plates was performed to detect the colony formation ability of A549 (c) and H1299 (d) cells stably overexpressing UCHL3 (n = 3); representative images are shown in the Supplementary section, and the results show that UCHL3 promotes colony formation. Data are shown as the mean ± SD; *p < 0.05, **p < 0.01. e, f UCHL3 was overexpressed in A549 (e) and H1299 (f) cells seeded in ultralow attachment dishes to allow tumor sphere formation, and the results are shown as a bar graph (n = 3, scale bar = 100 μm). Data are shown as the mean ± SD; **p < 0.01. g Flow cytometry analysis of ALDH activity in A549 cells overexpressing UCHL3 (n = 3). Data are shown as the mean ± SD; ****p < 0.0001. h, i Flow cytometry analysis showing side populations of cells among the A549 (h) and H1299 (i) cell lines overexpressing UCHL3, with the results shown as a bar graph (n = 3). Data are shown as the mean ± SD; **p < 0.01. j, k Representative images from flow cytometry analysis to detect CD338-positive A549 (j) and H1299 (k) cells overexpressing UCHL3, with the results shown as a bar graph (n = 3). Data are shown as the mean ± SD; *p < 0.05, **p < 0.01. l–n A xenograft model of tumor growth was established to evaluate the ability of A549 cells with stable UCHL3 overexpression to form tumors (n = 6 mice per group). Tumor formation was monitored at the indicated times (l), and images (m) and weight (n) are presented (n = 6). Data are shown as the mean ± SD; *p < 0.05, ****p < 0.0001. All data in bar graphs were assessed by two-tailed Student’s t-test

