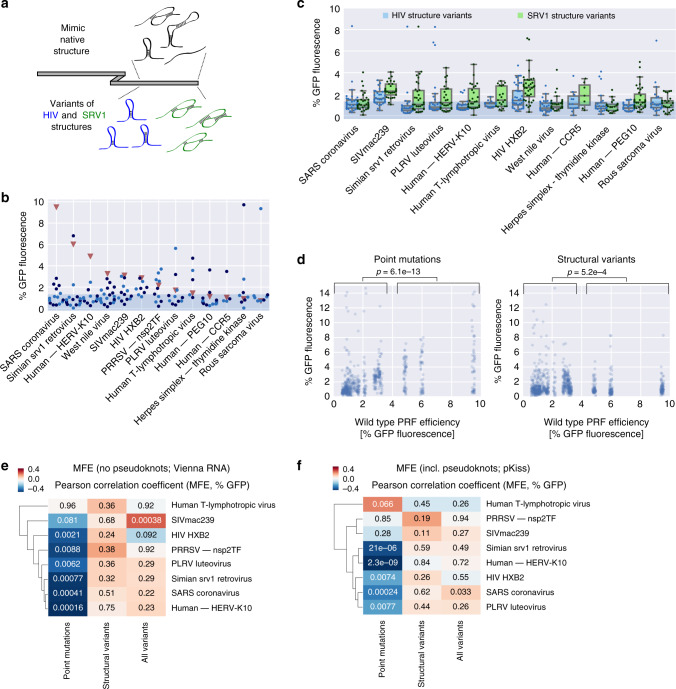
Fig. 4. Downstream RNA structure affects PRF efficiency in a context-dependent manner.
a Schematic of downstream structure variations. b Percent −1 GFP fluorescence of variants, in which the downstream region is replaced by a synthetic sequence predicted to fold into the respective native secondary structure (using Vienna RNA (only stem-loop; light blue) or pKiss (including pseudoknots; dark blue; Methods section)); the shaded area denotes the range of background fluorescence; n = 15, 17, 13, 19, 12, 8, 11, 11, 5, 17, 4, 8, and 8 sequences tested, in the order they appear on the graph. c % −1 GFP fluorescence of variants, in which the downstream region is replaced by a synthetic sequence predicted to fold into the HIV (blue) or SRV1 (green) secondary structure (or variations thereof; Methods section); the box shows the quartiles of the dataset, while the whiskers show the rest of the distribution except for outliers; the shaded area denotes the range of background fluorescence; n = 38/37, 32/29, 30/34, 32/29, 32/27, 16/21, 41/36, 34/31, 14/7, 23/20, 37/35, and 25/25 sequences tested for HIV and SRV1 structure variants, respectively, in the order they appear on the graph. d % GFP fluorescence of variants, in which the downstream region carried a single-point mutation (left) or was replaced with sequences predicted to fold into variations of PRF-inducing structures, plotted against the corresponding wild-type values; p-values (Mann–Whitney U) for comparisons between groups of low (<4% GFP fluorescence) and high wild-type PRF (>4% GFP fluorescence). e, f Clustered heat map of Pearson correlation coefficients between % −1 GFP fluorescence and minimum free energy of regions after the slippery site (computed using Vienna RNAfold on the 40 nt following the slippery site (e) or pKiss on the 120 nt following the slippery site (f)) for groups of variants of the indicated PRF sites; values denote the p-values of the correlations.

