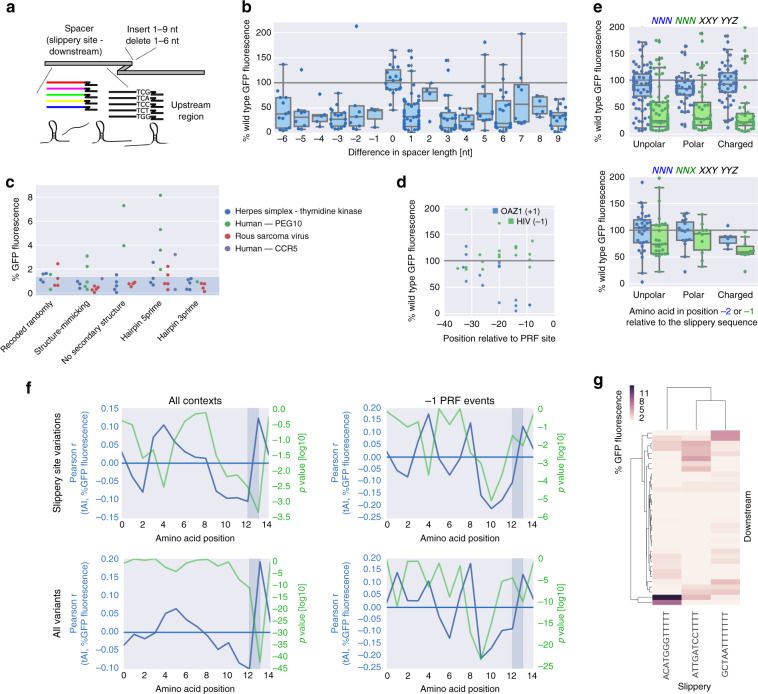
Fig. 5. Additional regulatory elements contribute to PRF.
a Schematic of sequence manipulations upstream and immediately downstream of the slippery site. b Boxplots of % wild-type frameshifting rates for variants of −1 PRF sites, in which the indicated number of nucleotides were deleted (negative numbers) or inserted (positive numbers, taken from two different constant sequences) after the slippery site; the box shows the quartiles of the dataset, while the whiskers show the rest of the distribution except for outliers; n = 13, 7, 4, 17, 7, 3, 16, 54, 4, 27, 10, 12, 23, 8, 6, and 23 sequences tested, in the order they appear on the graph. c % GFP fluorescence for variants of −1 PRF sites with the sequence upstream of the slippery site being randomly recoded or replaced with sequences predicted to have the indicated secondary structure; the shaded area denotes the range of background fluorescence. d % wild-type frameshifting rates (+1 for OAZ, blue, and −1 for HIV, green) of variants, in which the native upstream region has been replaced by constant sequences up to the indicated position relative to the PRF site. e Boxplot of percent of wild-type frameshifting rates for variants, in which the −2 or −1 amino acid relative to the slippery site is replaced with an amino acid from the indicated groups, for codons which would maintain the slippery site pattern XXXYYYZ (bottom) or not (top); the box shows the quartiles of the dataset, while the whiskers show the rest of the distribution except for outliers; n = 95/79, 43/39, 47/37 and 31/25, 16/10, 6/10 sequences tested. f Pearson correlation coefficient (blue) and associated two-tailed p-values (green) between tAI at the indicated position of the original reading frame and % GFP fluorescence. g Clustered heat map showing all possible combinations of 3 synthetic slippery sites, 34 synthetic downstream variants, and up to 5 synthetic upstream regions (minimal value 1.3%).

