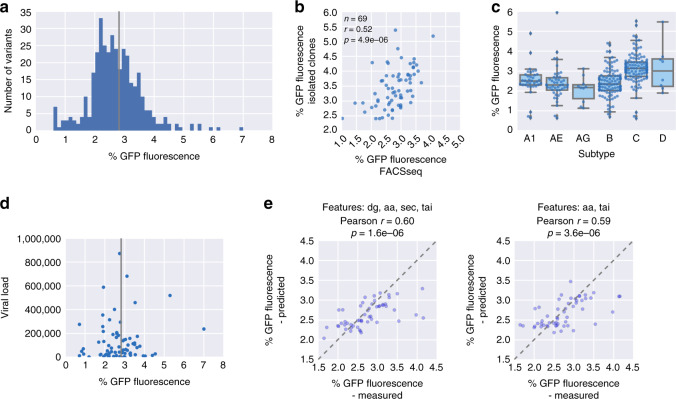
Fig. 7. Testing of PRF sites from HIV clinical isolates reveals subtype differences and associations with viral load.
a Distribution of percent GFP fluorescence of measured HIV variants, n = 368. b Percent GFP fluorescence as determined by FACSseq is plotted against the value determined by measuring the corresponding isolated clone by FACS; Pearson correlation coefficient and the associated two-tailed p-value are reported. c Boxplot showing percent GFP fluorescence of HIV gag-pol PRF variants coming from the indicated subtypes; the box shows the quartiles of the dataset, while the whiskers show the rest of the distribution except for outliers; n = 35, 46, 10, 103, 112, and 8 sequences tested, in the order they appear on the graph. d Viral load (HIV titer) is plotted against percent GFP fluorescence determined for the natural gag-pol PRF site variant from the corresponding clinical isolate; vertical line: HIV HXB2 wild-type percent GFP fluorescence, n = 77. e Predicted vs. measured percent GFP fluorescence for 20% of the HIV variants (held-out test set) with the full feature set except for the identity of slippery site positions (left) or after removing MFE features (middle) or all secondary structure derived features (right) features: Pearson correlation coefficient and the associated two-tailed p-value are reported.

