Figure 1.
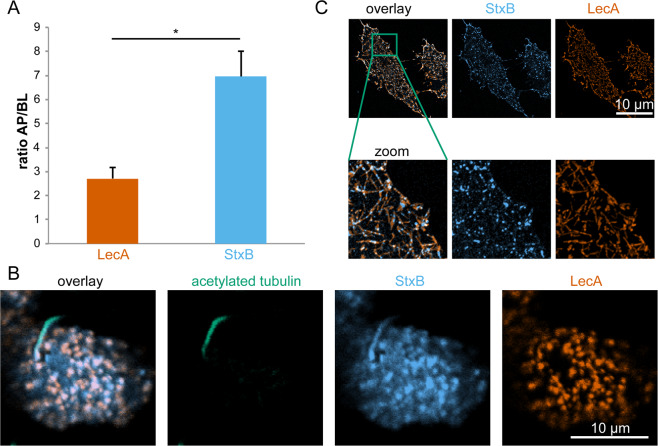
LecA and StxB show different binding patterns on cells. (A) MDCK cells stably expressing Gb3 synthase were mixed with wild type MDCK cells 1:10, seeded on transwell filters, and cultured for 4 d to form polarized monolayers. LecA-Alexa488 (117 nM) or StxB-Cy3 (106 nM) were applied only to the apical (AP) or basolateral (BL) side of the cells and incubated for 30 min at 4 °C. After washout, samples were fixed, mounted, and the intensities of AP or BL bound LecA or StxB were determined in single cells by measuring LecA-Alexa488 and StxB-Cy3 intensities from image stacks recorded with a confocal microscope. Then, the AP to BL signal intensities were calculated from the mean values from n > 50 cells per condition. The graphs display the mean values from 3 independent experiments, the error bars represent the standard error mean. Statistical significance was assayed with a paired two-tailed t-test, * indicates p < 0.05. (B) Polarized MDCK cells stably expressing Gb3 synthase were incubated apically with LecA-Alexa488 (196 nM, orange) and StxB-Cy3 (13 nM, blue) for 30 min at 37 °C. After washout of unbound lectin, cells were fixed and primary cilia were stained using an antibody recognizing acetylated tubulin (green). The images show confocal sections at the height of the apical plasma membrane. (C) HeLa cells were energy-depleted and then incubated with LecA-Alexa488 (98 nM) or StxB-Cy3 (106 nM) for 15 min at 37 °C. After fixation, cells were imaged with a TIRF-SIM microscope.

