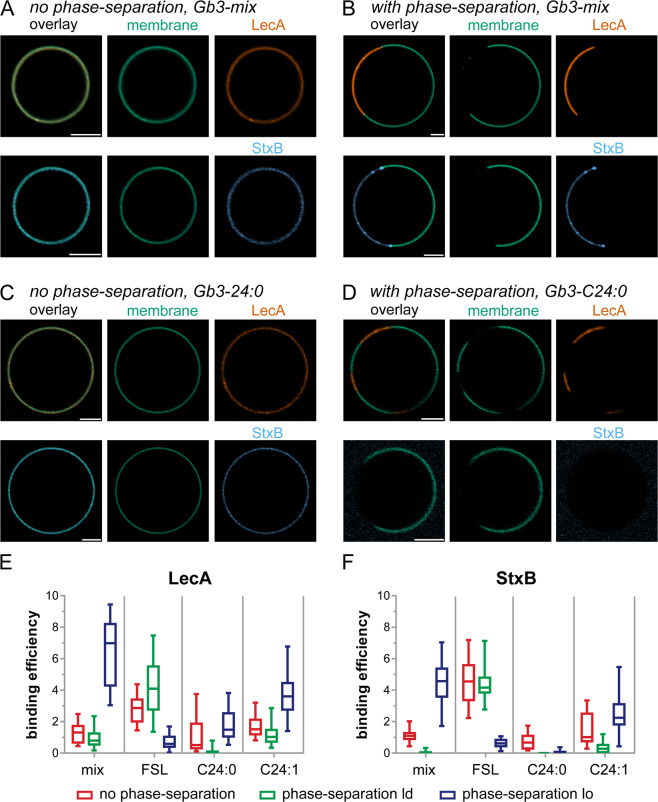
Figure 3.
Investigations how Gb3 species and phase separation influence LecA and StxB binding efficiencies. GUVs doped with 0.5 mol-% of the membrane marker β-BODIPY-FL-C5-HPC (green) and 5 mol-% Gb3-mix (A,B) or 5 mol-% Gb3-C24:0 (C,D) were incubated with LecA-Cy5 (200 nM, orange) or StxB-Cy5 (200 nM, blue). Non-phase-separated GUVs ((A,C) contained DOPC/cholesterol/Gb3 in the ratio 64.5/30/5 mol-%, whereas phase-separated GUVs (B,D) consisted of DOPC/cholesterol/sphingomyelin/Gb3 in the ratio 42.5/14.5/42.5/5 mol-%. The images A – D show equatorial sections through representative GUVs. Scale bars correspond to 5 μm. (E,F) Quantitative analysis of the binding efficiencies of LecA (E) and StxB (F) to non-phase-separated GUVs (red) or the ld (green) or lo (blue) phase of phase-separated GUVs containing 5 mol-% of either Gb3-mix (mix), Gb3-C24:0 (C24:0), Gb3-C24:1 (C24:1), or Gb3-FSL (FSL). For each condition, the middle horizontal line represents the median, the boxes the 25th to 75th percentiles, and the whiskers the min and max values. In Table S1 the descriptive statistics of the data are summarized and Table S2 contains the data from a significance analysis.

