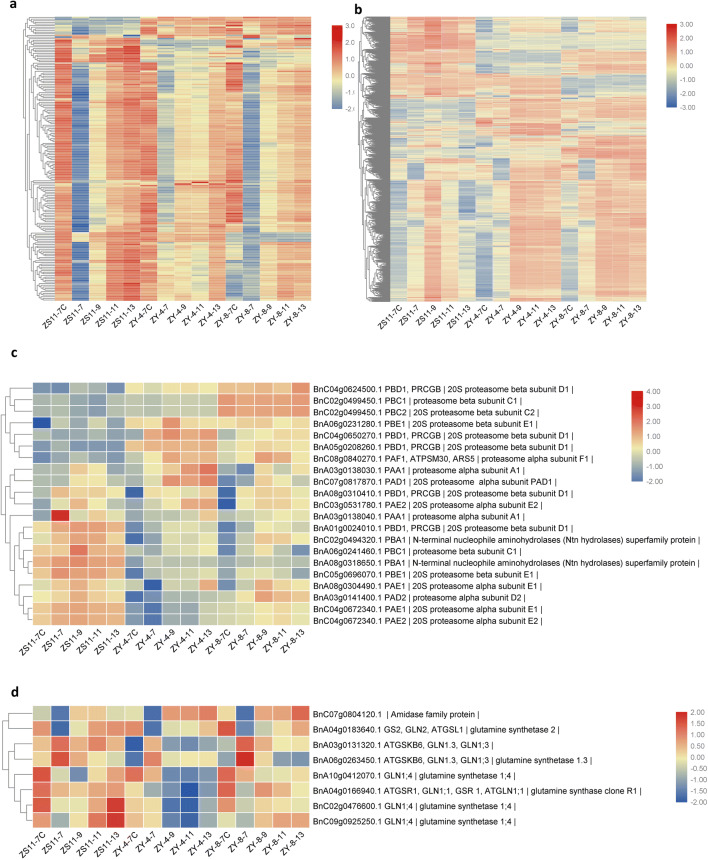
Fig. 7.
Heatmap showing the expression profiles of DEGs of photosynthesis genes (a), translation-related genes (b), 20S proteasome subunits genes (c), glutamine synthetase genes (d). a After 9DAS, the expression levels in two mutants were always downregulated compared with ZS11. b The expression levels of a significant number of translation-related genes did not decrease correspondingly after as ZS11 but maintained high expression levels after 9DAS. c The expression level of 20S proteasome subunits genes showed an opposite pattern between ZS11 and mutants. d Eight copies of glutamine synthetase genes were down-regulated to some extent in the two mutants; whereas in ZY-4, they decreased more than in ZY-8. DAS days after seeded

