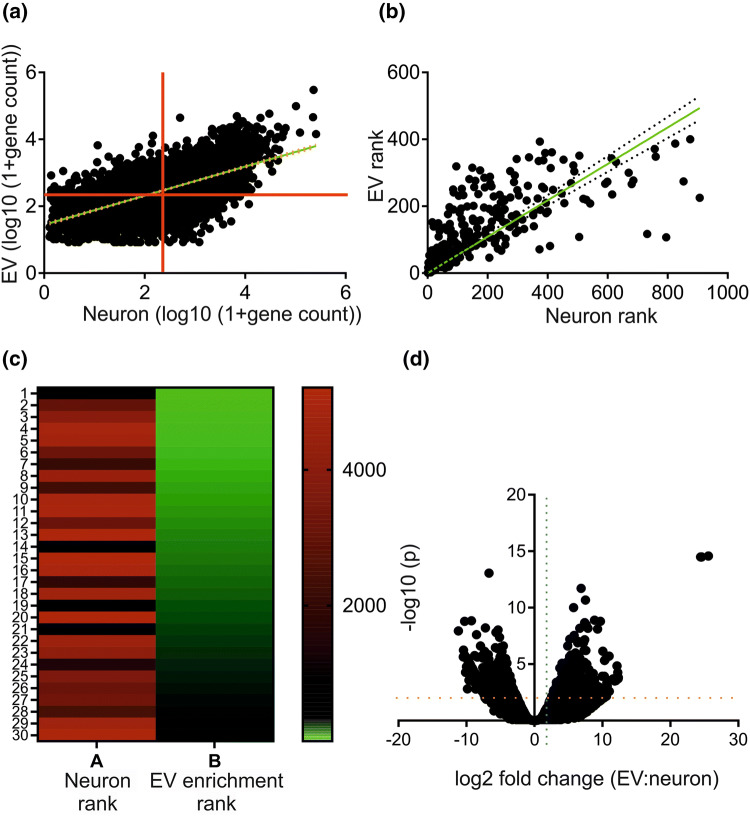
Fig. 3.
A subgroup of cellular mRNA transcripts are selectively incorporated into neuronal EVs. mRNA was extracted from iPSC-derived neurons (n = 3) and EVs (n = 2), followed by RNA Seq and bioinformatics as described. a Abundance of specific mRNA transcripts was compared in neurons and EVs (red line at mean, green line shows linear regression), followed by b rank comparison for the 500 most abundant mRNA transcripts in EVs (green line shows linear regression, dotted line shows 95% confidence) and c comparison of the top 30 most enriched mRNA transcripts in EVs against their rank abundance in neurons. d Volcano plot of all mRNA transcripts. Blue dotted line indicates the log2 fold change analysis threshold (log2 fold change > 1) and orange dotted line denotes the –log10 (p value) threshold (-log10 (p) > 2). n number refers to an independent induction of iPSCs to neurons, from each a sEV preparation was isolated (Color figure online)

