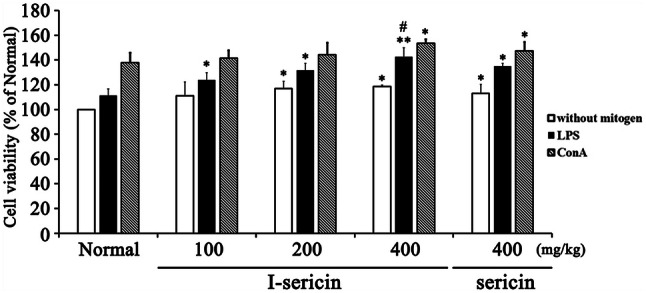
Fig. 3.

Cell proliferation of spleen cells treated with I-sericin and mitogen. Spleen cells isolated from mice fed I-sericin in the absence or presence of the LPS or ConA for 24 h. I-sericin; gamma-irradiated sericin. Data are expressed as mean ± SE (n = 10). *p < 0.05; **p < 0.01, compared with normal. #p < 0.05, compared with sericin at 400 mg/kg
