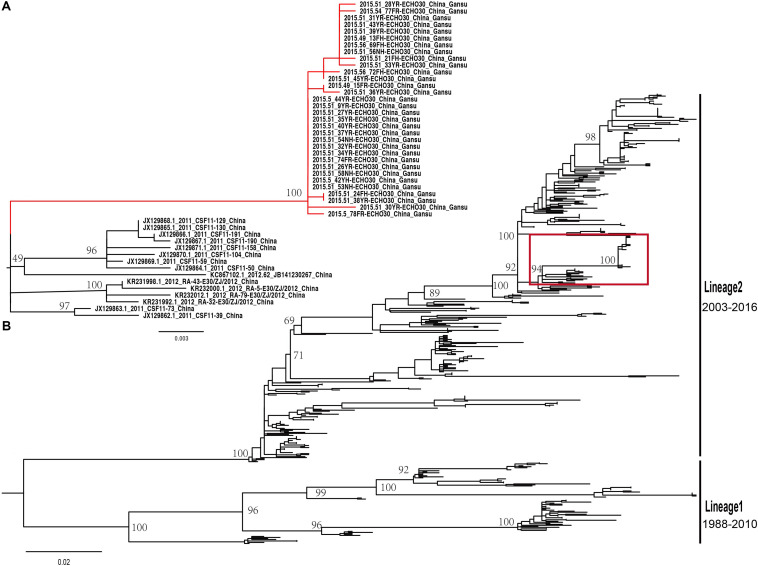
FIGURE 4.
(A) The magnification based on the red box of (B) and the branches colored in red represent the E-30 isolates from the collective outbreak of this study in 2015. (B) The midpoint-rooted maximum likelihood phylogenetic tree of 446 E-30 strains isolated from China. The scale bars represent the substitutions per site per year. The lineages 1 and 2 show the transmission lineages of E-30 in China, including the timespan of E-30 strains.

