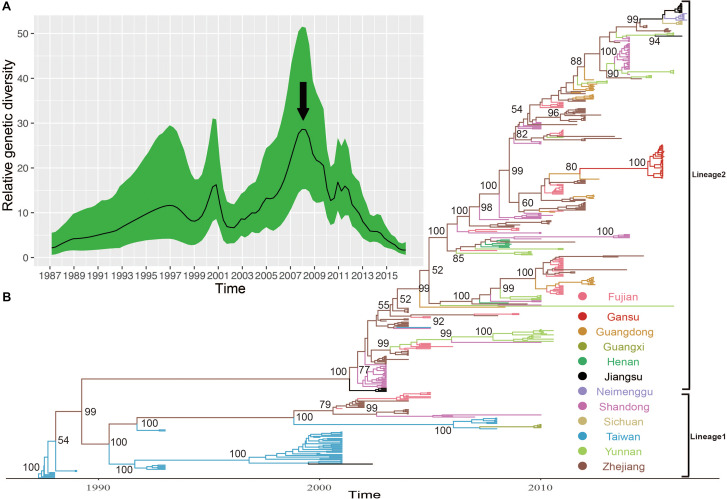
FIGURE 5.
(A) The relative genetic diversity of E-30 sequences in China. The black arrows show the important timescale that the relative genetic diversity of E-30 decrease signally. (B) The maximum clade credibility (MCC) phylogenetic tree based on the entire VP1 coding region in China and colored according to the locations of strains. The detailed information of isolates used in this study, including GenBank accession numbers, locations, and other essential information, are presented in Supplementary Table S1. The lineages 1 and 2 show the transmission lineages of E-30 in China, corresponding to Figure 4.

