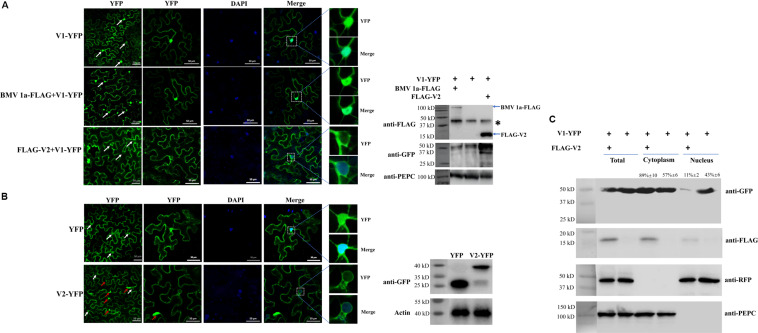
FIGURE 1.
The effect of V2 protein on the nuclear distribution of V1 protein. (A) Localization of the V1 protein in the absence or presence of the V2 protein in N. benthamiana cells. V1-YFP expressed alone, co-expressed with BMV 1a-FLAG or FLAG-V2, detected either by confocal microscopy (left panel) or by western blotting using an anti-GFP polyclonal antibody (right panel). Arrows point to the nuclear areas in cells. DAPI stains DNA in the nucleus. PEPC serves as a control for equal loading of total lysates. Asterisk indicates a non-specific bands detected in all samples. Bars: 50 μm. (B) Localization of V2 in N. benthamiana cells. The expressed YFP or V2-YFP in epidermal cells of N. benthamiana leaves was detected either by confocal microscopy (left panel) or by western blotting using an anti-GFP polyclonal antibody (right panel). White arrows point to the nuclear areas in cells as shown in left column. Red arrows point to V2 aggregates. DAPI stains DNA in the nucleus. Bars: 50 μm. (C) Distribution of V1 protein in the absence or presence of FLAG-V2 in H2B-RFP transgenic N. benthamiana plants as analyzed by using a nuclear-cytoplasmic fractionation assay. Nuclei were purified using percoll density gradient centrifugation. Western blotting was conducted with antibodies specific to the indicated proteins. PEPC and H2B-RFP were used as a marker for the cytoplasmic and nuclear fraction, respectively. The intensity of protein signal was measured by using ImageQuant TL (GE healthcare), with levels of the cytoplasm plus the nucleus levels totaling 100%.

