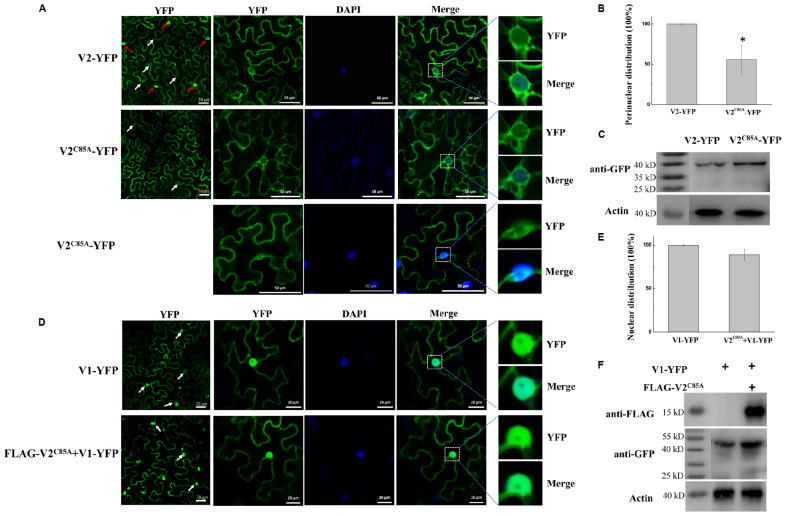
FIGURE 5.
Characterization of the V2C85A mutant. (A) Subcellular localization of V2 and V2C85A. DAPI stains DNA in the nucleus. White arrows in the left column point to the nuclear areas in cells. Red arrows point to V2 aggregates. Bars: 50 μm. (B) Quantification of perinuclear distribution of V2 and V2C85A. The number of cells with perinuclear distribution in different samples as in a. Experiments were repeated three times and 30 cells were observed in each repeat. Values represent percentages of cells with a perinuclear distribution of YFP signal ± SD (standard deviation). Data were analyzed using Student’s t-test and asterisks denote significant differences between V2-YFP- and V2C85A-YFP-infiltrated leaves (*P < 0.05). (C) Western blot analysis showing accumulated V2 and V2C85A using anti-GFP polyclonal antibody. Actin serves as a control for equal loading. (D) Localization of V1-YFP expressed alone or co-expressed with V2C85A in N. benthamiana leaves. Arrows in the left column point to the nuclear areas in cells. Bars: 20 μm. (E) Comparison of the nucleus-localized V1-YFP in the absence or presence of V2C85A. At least 150 cells were analyzed from three independent repeats. Values represent the mean ± SD in plants infiltrated with V1-YFP in the absence or presence of V2C85A. The data were analyzed using Student’s t-test. (F) The accumulated V1-YFP and FLAG- V2C85A as shown by western blot analysis.

