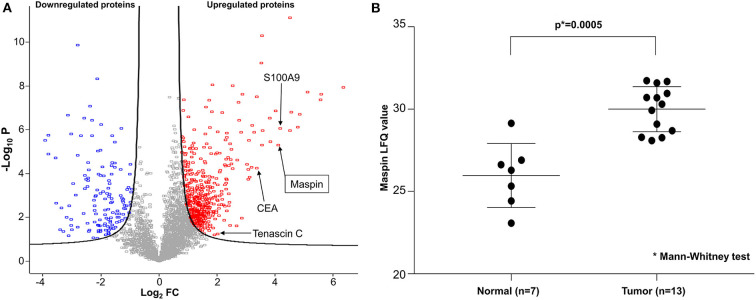
Figure 1.
Deep proteomic analysis of CRC by mass spectrometry. (A) Volcano plot of quantified protein changes from 15 patients. The curved solid line shows the FDR (false discovery rate) horizon of 0.05. The horizontal axis indicates log2-fold change (FC) of protein abundance (cancer relative to matched benign mucosa). The vertical axis shows –log10 of the t-test p-value. Up-regulated proteins are shown in red and down-regulated proteins are shown in blue. Maspin is highlighted by an arrow. (B) Statistical comparison of maspin protein levels detected by mass spectrometric label-free quantitation (LFQ).

