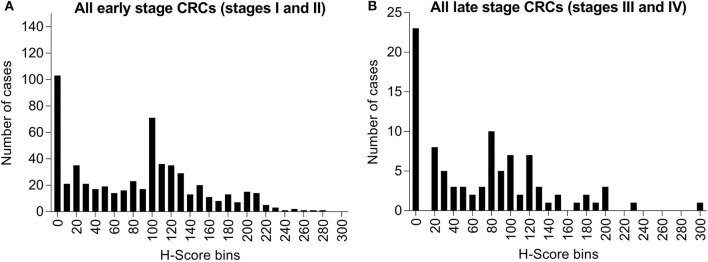
Figure 3.
Bar graph of maspin protein expression distribution derived from IHC staining of 743 CRCs. (A) Six-hundred and twenty-eight cases of early stage CRC (stages I or II) and (B) One-hundred and fifteen cases of late stage CRC (stages III or IV). The horizontal axis indicates H-score bins (bin width, 10). The vertical axis indicates the absolute case count for each H-score bin.

