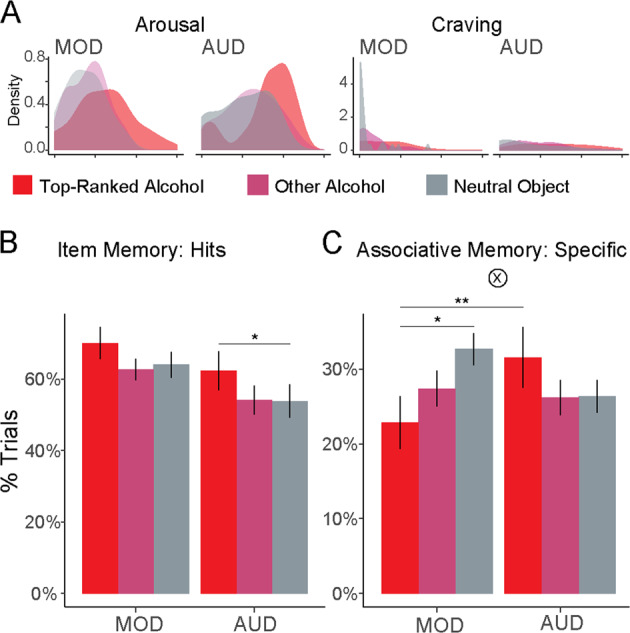
Fig. 3. Affective responses to alcohol drive memory biases.

a Density plots of arousal and craving ratings for trials containing photographs of the top-ranked alcoholic beverage. We computed affective responses per alcoholic beverage (weighted sum of arousal and craving with penalty for rating trials as neutral), and separated trials including the highest-ranked alcoholic beverage (“top-ranked alcohol”) from other alcohol and neutral object trials. b Item memory separated by drinking group and alcohol ratings, showing better item memory for more salient alcohol items. c Associative memory (specific) separated by drinking group and alcohol ratings. More salient alcohol items led to worse associative memory in moderate drinkers (MOD), but better associative memory in patients with alcohol use disorder (AUD). Gray bars (neutral objects) reproduced from Fig. 2c. Error bars = ±1 SE. *p < 0.05, **p < 0.01.
