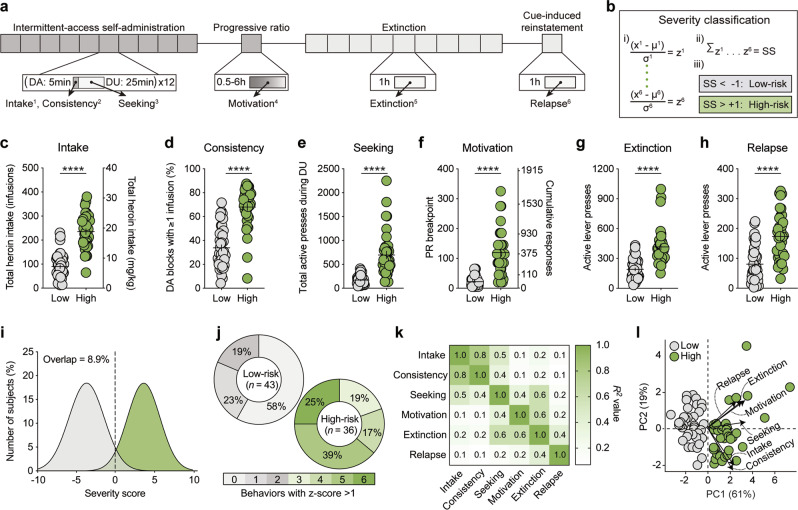
Fig. 1.
Heroin self-administration procedure and addiction severity classification. a Timeline of self-administration procedure and behavioral metrics used to classify addiction severity. Dark gray: periods of drug availability; light gray: periods of drug unavailability. (1) Intake: Total heroin intake; (2) Consistency: Percent of drug-available blocks with ≥1 infusion; (3) Seeking: Total active presses during drug-unavailable blocks; (4) Motivation: Breakpoint during PR; (5) Extinction: Total active presses during extinction; (6) Relapse: Total active presses during cue-induced reinstatement. b Severity classification: (i) raw behavioral data were converted to z-scores, (ii) z-scores were combined to give a cumulative severity score (SS), and (iii) individual rats were classified as low-risk (gray) or high-risk (green). c–h Compared to low-risk rats, high-risk rats c self-administered more heroin during IntA SA, d had a higher number of drug-available blocks where they engaged in drug-taking, e pressed the drug-paired lever more during drug-unavailable blocks, f had higher breakpoints during a PR test, g pressed the drug-paired lever more during extinction sessions, and h during the cue-induced reinstatement test. i Classification produces largely non-overlapping severity distributions between groups. j High-risk rats scored positive on more severity metrics than low-risk rats. k Individual severity metrics are all significantly correlated (all p < 0.05), though the relationship between pairs of metrics are highly variable. l Principal component analysis of severity metrics, with individual rats and the original severity metrics (length = eigenvalue, angle = eigenvector) replotted on the resulting two-dimensional space. DA, drug-available; DU, drug-unavailable; IntA, intermittent-access; PC, principal component; PR, progressive ratio; SA, self-administration; ****p < 0.0001 (low vs high).

