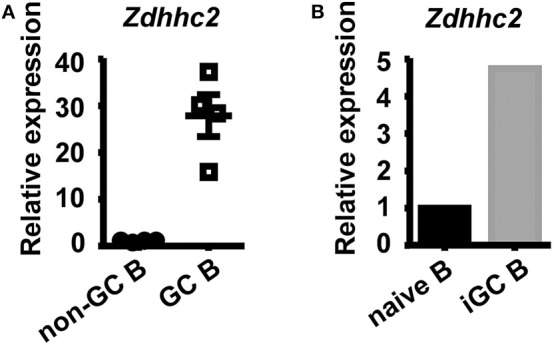
Figure 5.

High expression levels of Zdhhc2 in germinal center (GC) B cells. (A,B) Graphs showing the relative Zdhhc2 mRNA levels, quantified by qRT-PCR, in non-GC B and GC B cells sorted by fluorescence-activated cell sorting (FACS) from Peyer's patches of wild-type mice (A), FACS-sorted splenic naïve B cells, and induced GC B cells (iGC B) cultured as in Figure 4A. Each symbol in (A) represents the sample from an individual mouse. N = 1 in (B).
