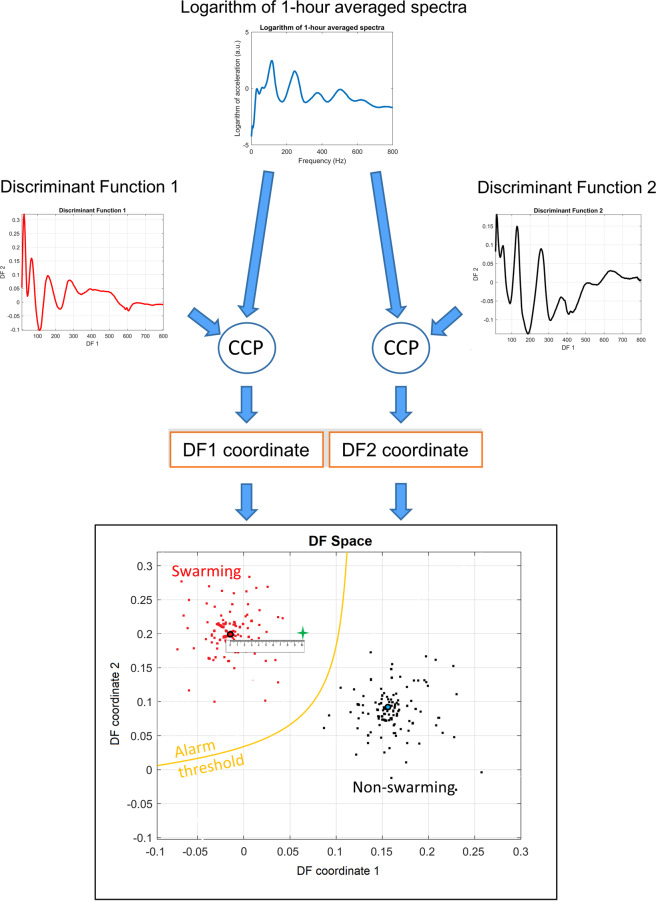
Figure 1.
The instantaneous alarm procedure. The images in Fig. 1 are solely for illustrative purposes. This figure depicts the processing for the detection of swarming in the post-training phase. Each hour-long averaged spectrum is compared, using the cross-correlation product (CCP), to a pair of DF curves, as determined by the DFA algorithm (see Fig. 2), providing the co-ordinates for a single point in the DF space (green ‘+’ sign). The Euclidean distance to the swarming and non-swarming centroids (the central point of all swarming and non-swarming spectra, used in the training phase, respectively shown as a red dot with black outline and green dot with blue outline) are calculated. The ratio of these distances provides our “criterion value”, and is compared to an optimised threshold value (see Methods) to determine if it is the spectrum of a colony intending to swarm or not, i.e. if the point in DF space lies within the upper left “swarming area” bordered by the yellow line. In this figure, for ease of representation, we give an example using two discriminant functions, however, in this study, three discriminant functions were used. Plots used in the creation of this figure were generated using the MATLAB (R2018b) software (uk.mathworks.com).

