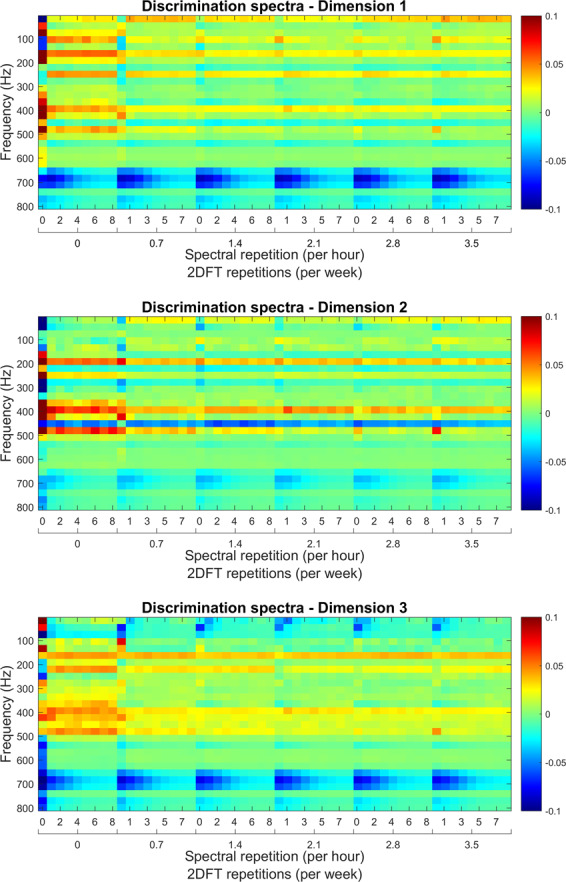
Figure 5.

The three discrimination spectra for the spectral evolution algorithm. The pixel colour indicates the negative (blue), positive (red) or zero (green) contribution the user must give to a particular part of the vibrational 3DFT in order to get the first (top), second (middle) or third (bottom) DF score. The frequency components of the FFT of the 2DFTs are shown stacked from left (0 repetitions per week) to right (3.5 repetitions per week) for ease of viewing. This figure was created using the MATLAB (R2018b) software (uk.mathworks.com).
