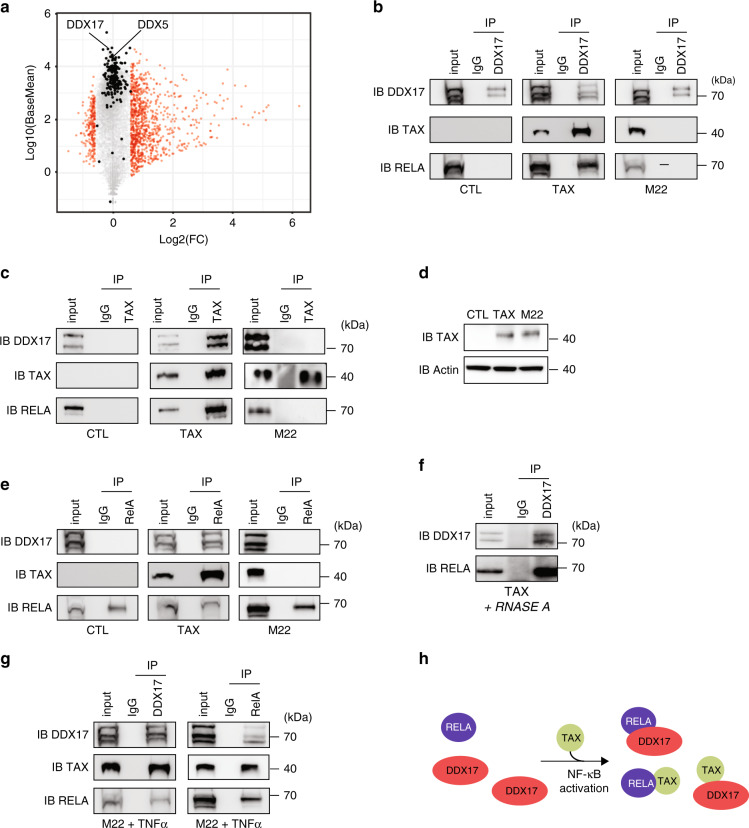
Fig. 2. Physical interactions between Tax, RELA, and DDX17 in an NF-kB dependent manner.
a Mean average plot (n = 3, p < 0.05) of cellular gene expressions upon Tax. Each gene is plotted according to its expression level (log10(BaseMean) from DESeq2 analysis) and to fold change (log2-FC) upon Tax. Red dots show significant gene expression changes in HEK cells (log2-FC > 0.6, p < 0.05, Fisher’s exact test). Black dots highlight genes encoding splicing factors. DDX5 and DDX17 are indicated. b Immunoprecipitation assays (IP) were carried out in HEK cells using isotype IgG or anti-DDX17 (b, g), anti-RELA (e, g), and anti-Tax (c, g) antibodies, followed by immunoblotting (IB) with indicated antibodies. d Western blot analysis of Tax and M22 expression 48-h post-transfection. f RNA-free IP assays. g TNFa exposure of M22-expressing cells promotes RELA–DDX17 interactions. h Model of NF-κB-dependent interplay between Tax, RELA, and DDX17. For b–g, a representative image from three independent experiments is shown. Source data are provided as a Source Data file.

