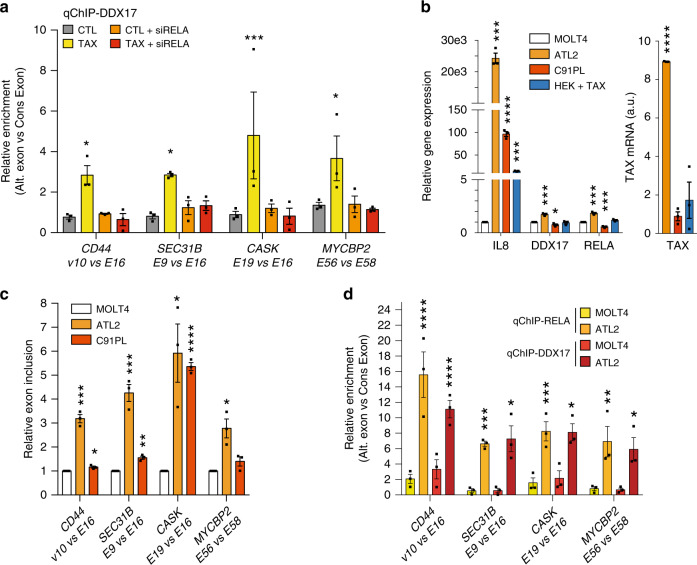
Fig. 5. RELA locally recruits DDX17 at the genomic target exons, leading to splicing regulation.
a Relative occupancy of DDX17 at Tax-regulated genomic exons in cells that did or did not express Tax and knocked down or not with RELA-specific siRNA. b Relative gene expression levels of IL8, DDX17, and RELA in ATL2, C91PL, or HEK cells transiently transfected by pSG5M-Tax as compared uninfected MOLT4 cells. Tax mRNAs levels are expressed in arbitrary units (a.u.). c Alternative splicing modifications in the HTLV-1-infected cell lines ATL2 and C91PL as compared to those in the uninfected cell line MOLT4. Relative exon inclusion was measured as described in Fig. 3. d Relative RELA and DDX17 occupancies of regulated exons in ATL2 cells as compared to MOLT4 cells. Each occupancy of regulated exon by RELA and DDX17 is represented as a fold of that measured at its neighboring constitutive exon. Source data are provided as a Source Data file. Data are presented as the mean ± SEM values from biological replicates. Each black square represents a biological replicate. Statistical significance was determined with two-way ANOVA followed by Fisher’s LSD test (a, d) and two-tailed unpaired t-test (b, c) (*p < 0.05, **p < 0.01, ***p < 0.001, ****p < 0.0001). Exact p-values for Tax vs CTL (a): 0.0312 (CD44), 0.0337 (SEC31B), 0.0002 (CASK), 0.0171 (MYCBP2). Exact p-values for ATL2- and C91PL vs MOLT4 (b): 0.0001, 0.0004, 0.0003 and <0.0001, 0.0365, 0.0007 corresponding to IL8, DDX17, and RELA, respectively. For Tax expression, p = 0.0016 HEK + Tax vs ATL2. Exact p-values for ATL2- and C91PL vs MOLT4 (c): 0.0002, 0.0008, 0.0153, 0.0105 and 0.019, 0.0013, <0.0001, 0.11 for CD44, SEC31B, CASK, and MYCBP2 respectively. Exact p-values (d) for ATL2 vs MOLT4: qChIP-RELA < 0.0001 (CD44), 0.0003 (SEC31B), 0.0004 (CASK), 0.0029 (MYCBP2); qChIP-DDX17 0.0004 (CD44), 0.0211 (SEC31B), 0.0207 (CASK), 0.0184 (MYCBP2). Source data are provided as a Source Data file.

