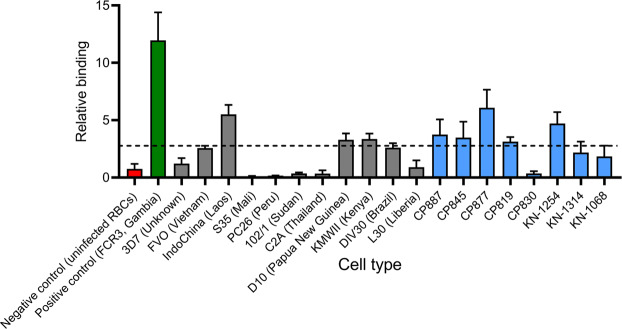
Figure 4.
Relative binding of Malaria.1 to various cell types. Five million cells for each strain per well were incubated with 150 nM of Malaria.1. After three washes, the amount of 32P-labeled aptamer was determined by liquid scintillation counting. Fold change in binding of aptamer Malaria.1 was determined by normalizing to the background binding. Background binding to each cell type was determined as the average signal of two random sequence oligonucleotides (RDM1 and RDM2). The negative control cells are uninfected RBCs (red). The positive control cell type is the strain used in the selection experiment, FCR3 (green). Bars in grey represent cultured cell lines. Bars in blue indicate cells from patients, where CP cell lines are short-term cultures derived from recent Cambodian infections and KN from Malian infections. The dashed horizontal line represents the of threshold of positive binding defined as the mean fold difference plus 3 standard deviations for random sequence binding to uninfected erythrocytes from 6 US donors. Values and error bars represent the mean and standard deviation of three replicates.

