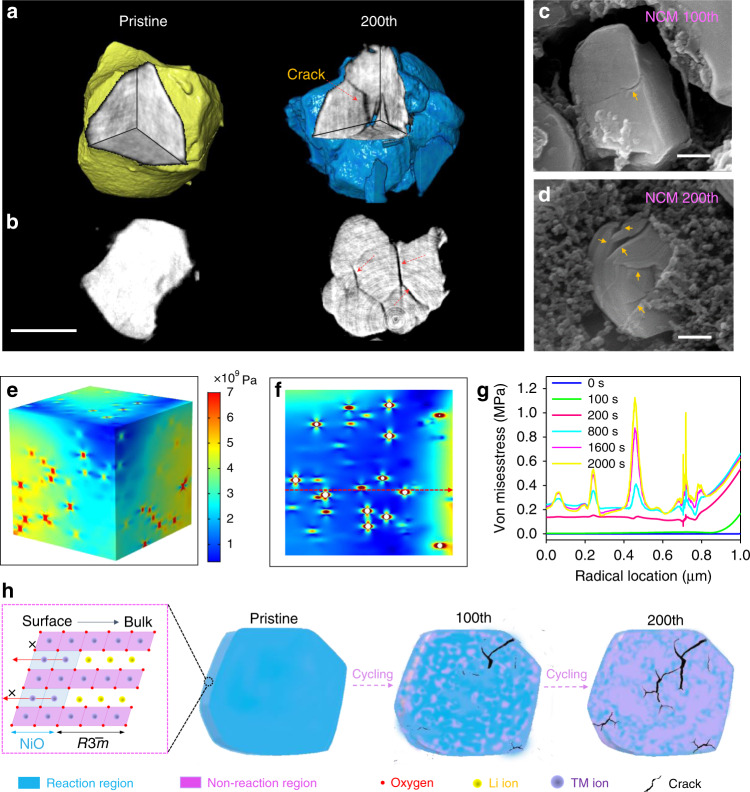
Fig. 6. 3D reconstruction and structural degradation mechanism.
a, b X-ray nano-tomography reconstruction with volume rendering shows the morphological evolution of NCM after cycling. Scale bars 2 μm. c, d SEM images of the NCM microsphere after 100 and 200 cycles. Scale bars 500 nm. Equivalent stress within the NCM particles: e 3D semitransparent view. f 2D view of the cross profile. g Von Mises stress within the NCM particles along the imaginary line. h structural degradation mechanism in NCM.

