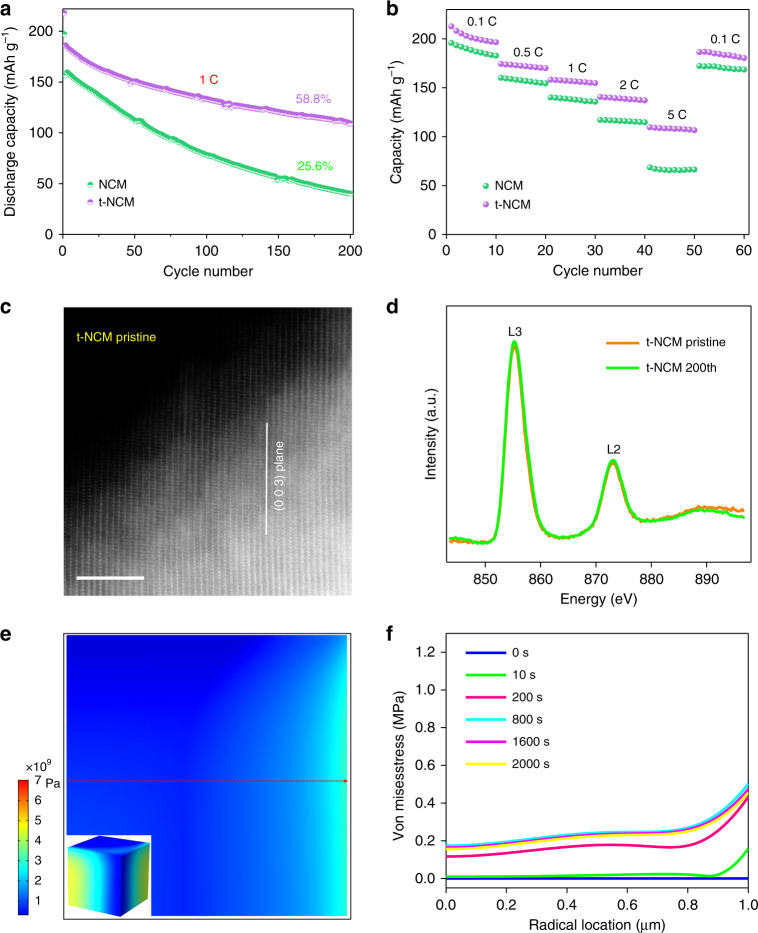
Fig. 8. Structural analysis of improved stability in the t-NCM.
a Cycling performance comparison plot of untreated NCM and t-NCM. b NCM and t-NCM rate capabilities. c Atomic resolution HAADF-STEM images of pristine and cycled t-NCM samples. Scale bars 5 nm. d Soft XAS spectra of Ni L-edge for t-NCM. Equivalent stress within the NCM particles: e 2D view of the cross profile. The illustration in the picture is 3D semitransparent view. f Von Mises stress within the NCM particles along the imaginary line.

