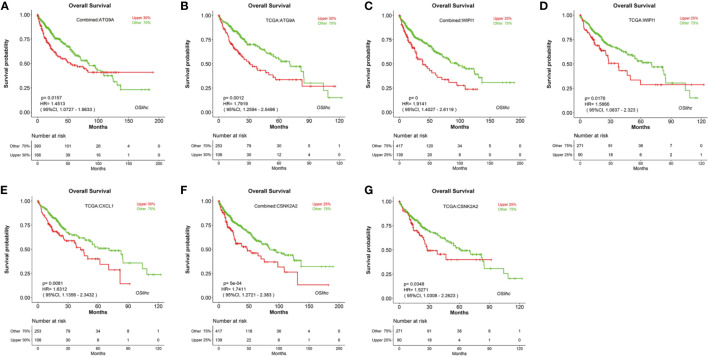
Figure 5.
Evaluation of the prognostic values of potential biomarkers in OSlihc. Kaplan–Meier plots for high (red) and low (green) ATG9A, WIPI1, CXCL1, or CSNK2A2-expression cohort in combined dataset (A, C, F) and TCGA dataset (B, D, E, G). p-value, confidence interval (95%CI) and number at risk are as shown. The y-axis represents survival rate and the x-axis represents survival time (months).

