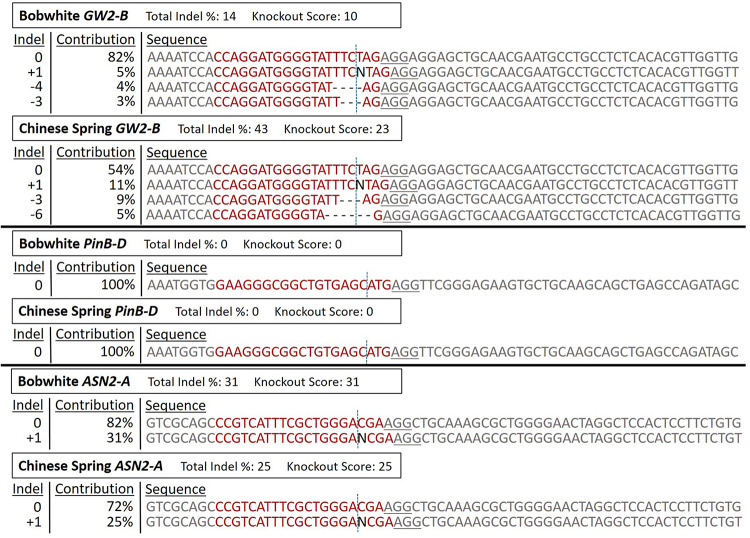
FIGURE 5.
ICE Analysis of CRISPR RNP edited protoplast cells. The RNP edited samples from Figure 4 were sequenced with Sanger sequencing, and then analyzed with the online program ICE to deconvolute the pooled DNA. ‘Bobwhite GW2-B’ corresponds to ‘BW-GW2-B RNP,’ ‘Chinese Spring GW2-B’ corresponds to the first ‘CS-GW2-B RNP’ sample, ‘Bobwhite PinB-D’ corresponds to ‘BW-PinB-D RNP,’ ‘Chinese Spring PinB-D’ corresponds to ‘CS-PinB-D RNP,’ ‘Bobwhite ASN2-A’ corresponds to ‘BW-ASN2A RNP,’ and ‘Chinese Spring ASN2-A’ corresponds to ‘CS-ASN2-A RNP’ from Figure 4. For each of these samples, the corresponding negative control from the T7EI assay was used as the control sequence in ICE. ‘Total Indel %’ is the editing efficiency, or the percent of the total pool of protoplast samples that are not wild-type sequences. ‘Knockout Score’ is the proportion of protoplasts in each sample that either have a frameshift mutation or have an indel of 21 nucleotides or more. The sgRNA target sequence is shown in red. The vertical dotted line represents the expected cut site based on the sgRNA sequence. The underlined sequence in gray is the PAM sequence used by Cas9. ‘Indel’ is the number of nucleotides either inserted or deleted in each sequence type. ‘Contribution’ is the percent of all sequences that have each specific indel type.

