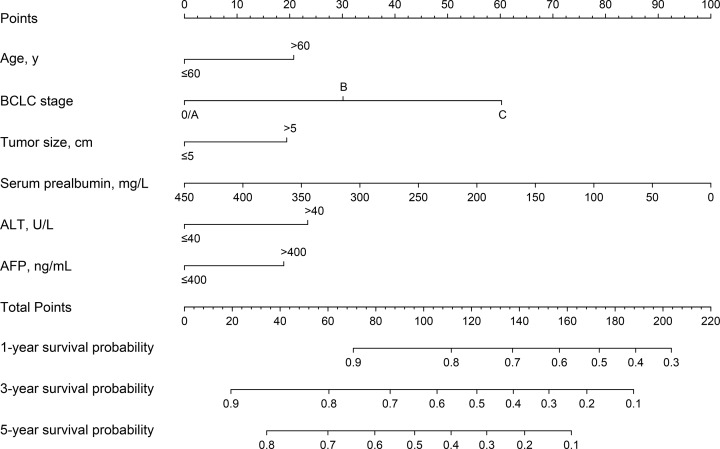
Figure 4. The nomogram developed in the present study.
A nomogram to predict the survival time of patients with HCC after hepatectomy. The nomogram allows the user to obtain the probability of 1-, 3-, and 5-year survival probability corresponding to a patient's combination of covariates. As an example, locate the patient's BCLC stage and draw a line straight upward to the ‘Points’ axis to determine the score associated with that BCLC stage. Repeat the process for each variable, and sum the scores achieved for each covariate, and locate this sum on the ‘Total Points’ axis. Draw a line straight down to determine the likelihood of 1-, 3-, or 5-year survival probability.

