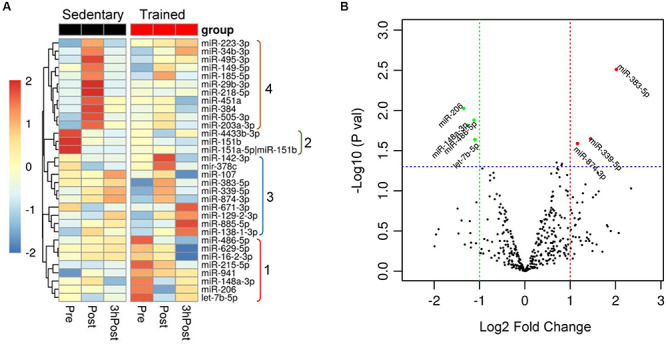
FIGURE 2.

Differential expression of circulating exomiRs at baseline in the trained and sedentary groups. (A) Heat map with dendrogram illustrating clustering results for the 32 exomiRs identified as differentially expressed when comparing miRNA expression changes between groups (sedentary vs. trained) at baseline (Pre) and between time points (Post vs. Pre and 3hPost vs. Pre) within each group. Hierarchical clustering was applied using the average linkage method and Euclidean distance. Values signify the log2-transformed cpm (counts per million reads of the library size) normalized within each row such that the mean is zero and the standard deviation is one. Colors represent the level of miRNA expression; red: high expression; green: low expression. Groups numbered from 1 to 4 on the right highlight exomiRs that were differentially expressed at baseline (1 and 2) and at Post (4) between sedentary and trained subjects, and those differentially expressed at either Post or 3 hPost relative to Pre in trained subjects (3). (B) Differential expression of circulating exomiRs in the trained relative to sedentary group at baseline (Pre). The p-value in log10 scale of each miRNA is plotted against its fold change in log2 scale and each circle denotes a miRNA. The miRNAs with p-values ≤ 0.05 and log2 (fold change) ≥ 1 in either direction is represented by either red circles (upregulated) or green circles (downregulated). Three circulating exomiRs were upregulated and one was downregulated in the trained compared to sedentary group.
