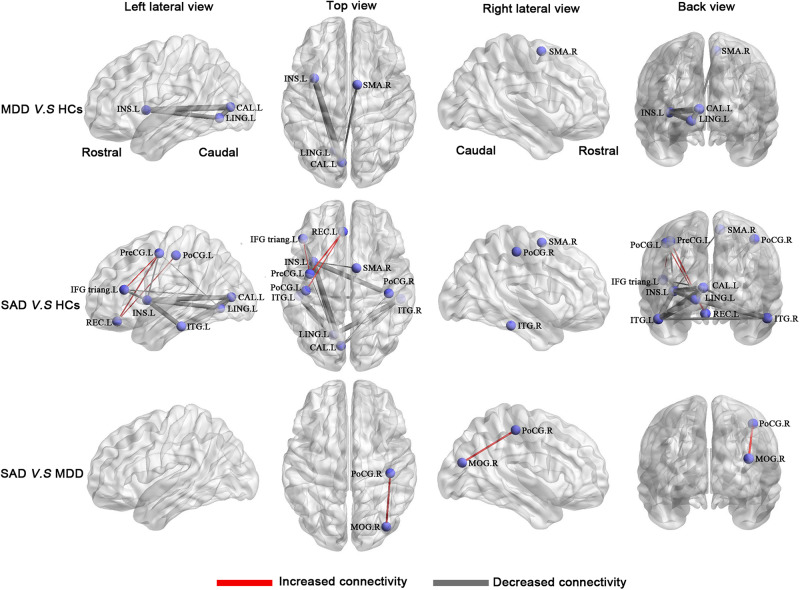
FIGURE 4.
Between-group results of the brain structural connectome (corrected p < 0.05). Row 1: MDD patients compared with HCs. Row 2: SAD patients compared with HCs. Row 3: SAD patients compared with MDD patients. The purple nodes represent the regions with significantly altered morphological connections. The line width represents the t-value between groups, and the wider of the lines, the higher of the t values (for details of t values, see Table 5). Increased connections are presented in red, and decreased connections are presented in gray. Abbreviations: CAL, calcarine cortex; HCs, healthy controls; IFG triang, inferior frontal gyrus triangular part; INS, insula; ITG, inferior temporal gyrus; L, left; LING, lingual gyrus; MDD, major depressive disorder; MOG, middle occipital gyrus; PoCG, postcentral gyrus; PreCG, precentral gyrus; R, right; REC, rectus gyrus; SAD, social anxiety disorder; SMA, supplementary motor area.

