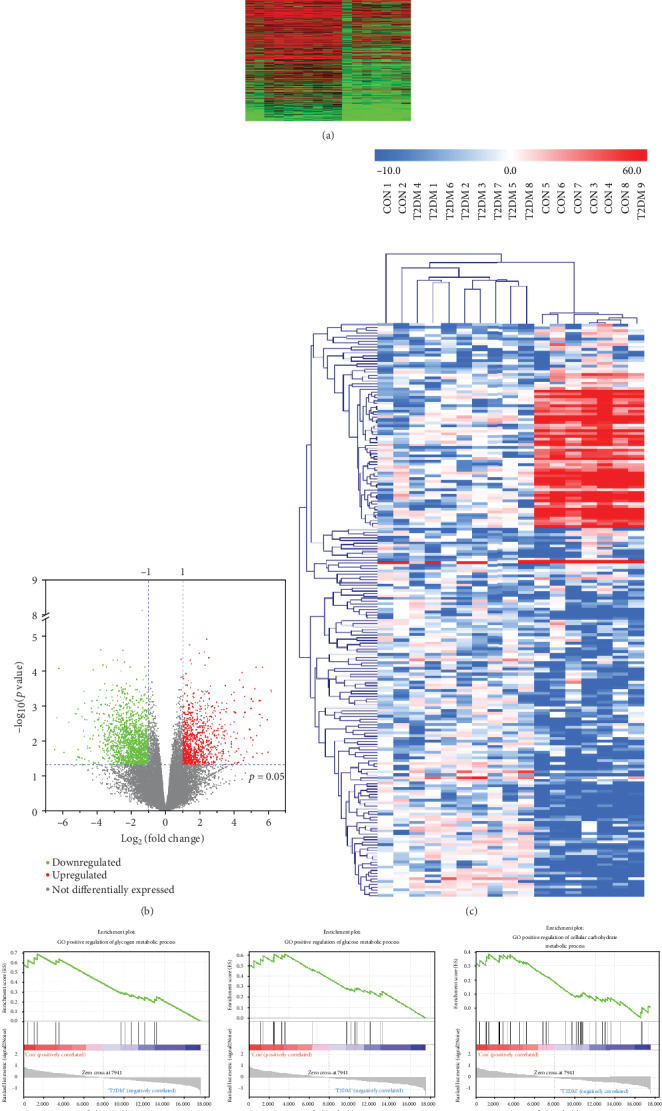
Figure 1.

Gene expression differences in the blood from T2DM patients and nondiabetic controls and gene set enrichment analysis (GSEA). (a, b) Heat map and volcano plots showing significantly differentially expressed genes with a greater than twofold change in the blood from the two groups of patients. (c) Cluster heat map showing differentially expressed genes with a fold change greater than 10. (d) GSEA results showing the differences in glucose and lipid metabolism in the blood from T2DM patients and nondiabetic controls.
