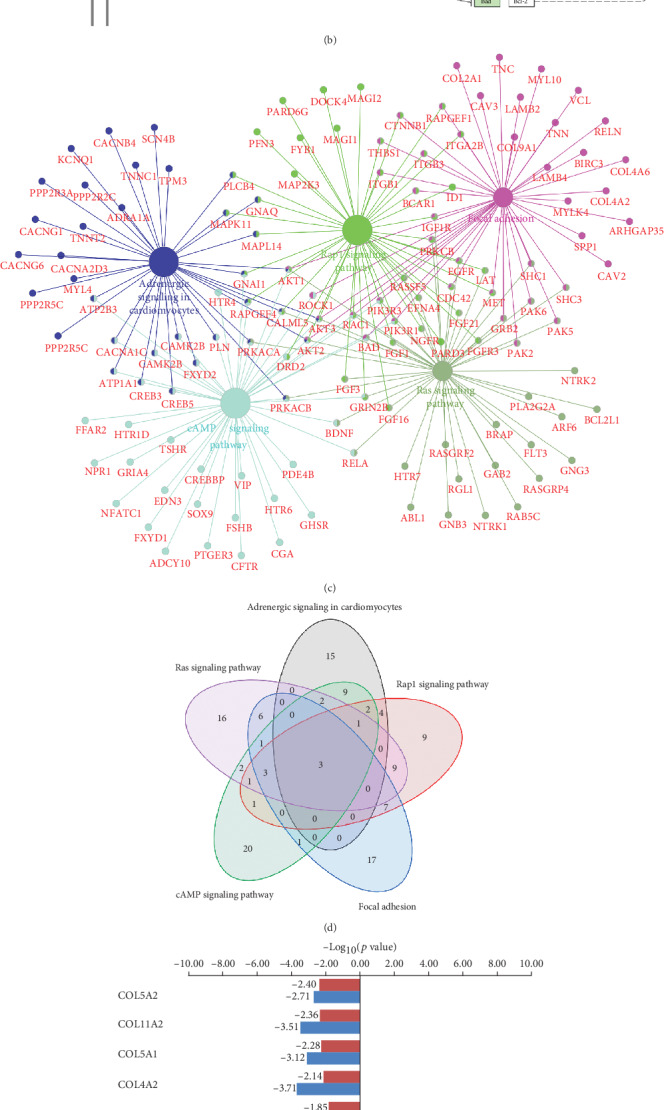
Figure 4.

Analysis of biological pathways of differentially expressed genes in the blood of T2DM patients compared with nondiabetic controls. (a) The fold enrichment, gene numbers, and p value in KEGG pathway analysis of differentially expressed genes. (b) Schematic diagram of the focal adhesion signaling pathway showing that extracellular matrix proteins can regulate osteoblast differentiation by binding to integrins, increasing FAK phosphorylation, and activating the downstream Wnt signaling pathway. (c) Interaction analysis of differentially expressed genes in the differential KEGG pathways. (d) Venn diagram showing the number of overlapping genes among the KEGG pathways. (e) Differential expression status of the focal adhesion pathway-related collagen genes among the differentially expressed genes (the T2DM group compared with the CON group). (f) Random forest analysis of the aforementioned collagen genes.
