-
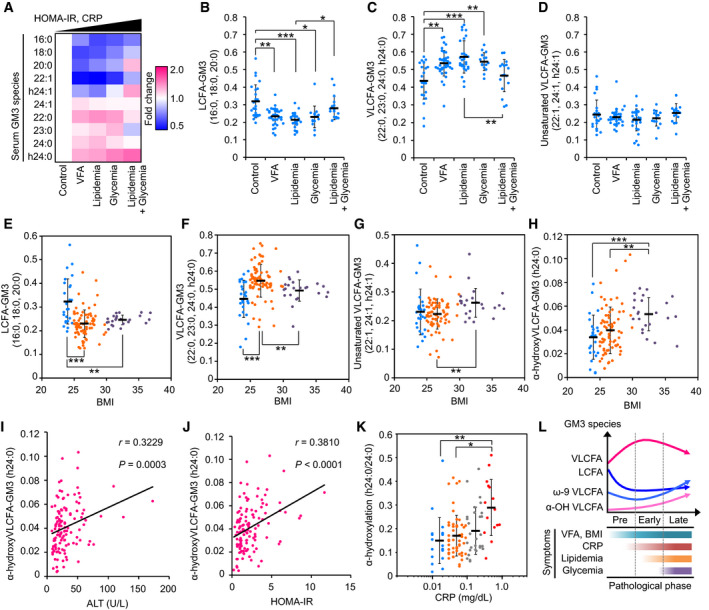
A
Heat map analysis of serum GM3 species in various pathological phases: control (n = 24), VFA (n = 38), lipidemia (n = 28), glycemia (n = 15), and lipidemia + glycemia (n = 17). Colors indicate fold change average of each species relative to control (defined as 1), as shown in key at right. Order of pathological phases corresponds to increments of HOMA‐IR and serum CRP.
-
B–D
Properties of various GM3 species as a function of pathological phases: control (n = 24), VFA (n = 38), lipidemia (n = 28), glycemia (n = 15), and lipidemia + glycemia (n = 17). Data shown are relative abundances of total LCFA species (16:0, 18:0, 20:0) (B), total VLCFA species (22:0, 23:0, 24:0, h24:0) (C), and total unsaturated VLCFA species (22:1, 24:1, h24:1) (D) relative to total of ten major GM3 species (defined as 1) in each subject.
-
E–H
Properties of various GM3 species as a function of BMI: LCFA‐GM3 (E), VLCFA‐GM3 (F), unsaturated VLCFA‐GM3 (G), and α‐hydroxy VLCFA‐GM3 (h24:0) (H). Colors indicate disease severity: light blue, no abnormal scores (n = 25); orange, early‐phase obesity (n = 74); purple, severe obesity (n = 23).
-
I, J
Spearman's correlations for GM3 h24:0 vs. ALT (I) and vs. HOMA‐IR (J).
-
K
Plots of α‐hydroxylation rate (h24:0/24:0) vs. serum CRP. Colors indicate range of CRP value (mg/dl): light blue, 0.01–0.02 (n = 21); orange, 0.03–0.09 (n = 56); gray, 0.10–0.29 (n = 29); red, 0.3–1.0 (diagnostically abnormal; n = 15).
-
L
Association between serum GM3 species and progression of metabolic disorders (schematic).
Data information: Data shown are individual values and mean ± SD, analyzed by two‐tailed unpaired
‐test with Bonferroni's correction. *
< 0.001 for comparisons between indicated groups.