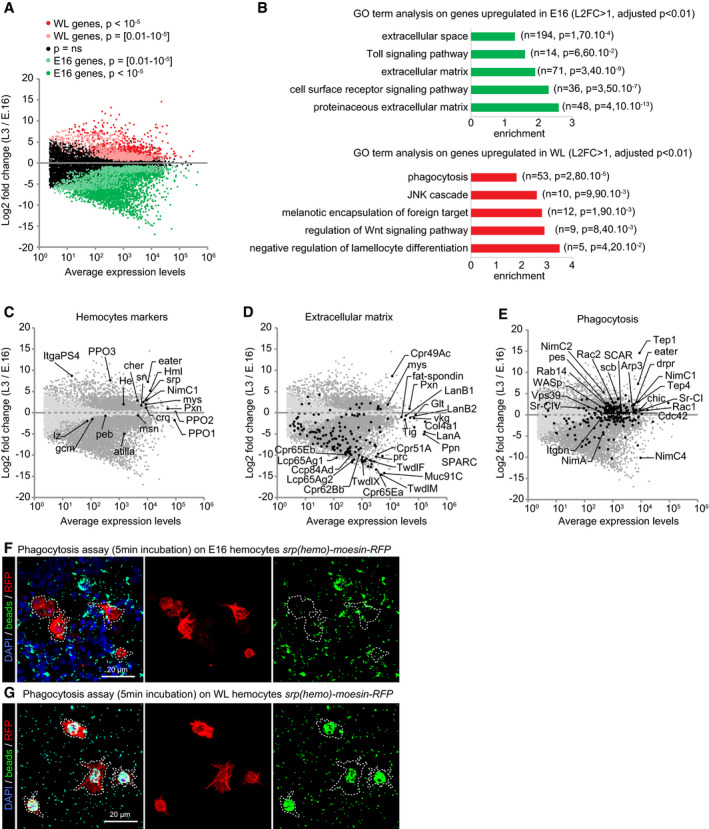
Figure 1. Hemocytes display distinct properties at E16 and WL stage.

-
ATranscriptome comparison of hemocytes from stage 16 (E16) embryos and wandering 3rd‐instar larvae (WL). The x‐axis is the average gene expression levels (n = 3), and the y‐axis is the log2 fold change WL/E16. P‐values are indicated with the color code.
-
BGene Ontology (GO) term enrichment analysis in E16 (green) and WL (red) hemocytes. The fold enrichments for a subset of significant GO terms are displayed; the number of genes and the P‐value of the GO term enrichment are indicated in brackets.
-
C–EScatter plots as in (A) highlighting in black subsets of known genes expressed in hemocytes (C) or genes associated with the GO term extracellular matrix (D) and phagocytosis (E).
-
F, GPhagocytosis assay on E16 (F) and WL hemocytes (G) srp(hemo)‐moesin‐RFP. The beads (in green) are phagocytosed by the hemocytes (in red). The WL hemocytes show greater phagocytic capacity compared to the embryonic ones after 5 min of exposure. Full stacks are displayed, and the scale bars represent 20 μm.
