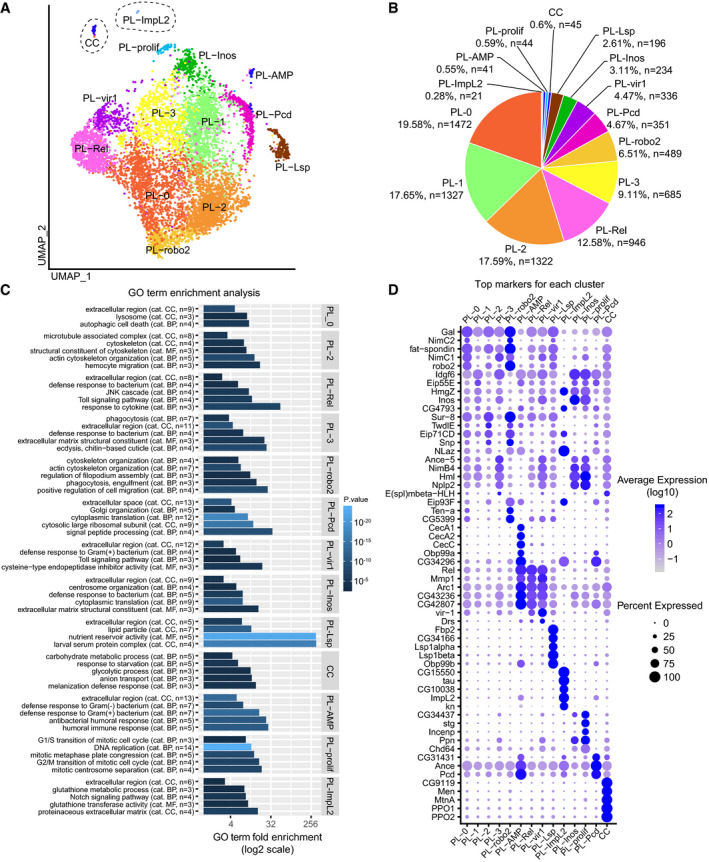
Figure 2. Fourteen hemocyte populations can be distinguished in WL by single‐cell RNA‐seq.

- UMAP projection representing the 14 clusters of cells identified in the hemocyte pools from OregonR WL (NI dataset).
- Number of cells and proportion of each cluster in the NI dataset.
- GO term enrichment analysis for each cluster. The x‐axis is the GO term enrichment, the color gradient (black to light blue) indicates the P‐value, and the number of genes and the GO term category (CC: cellular compound, BP: biological process, MF: molecular function) are indicated between brackets.
- Top 5 markers of each cluster. The expression levels are represented by the gradient of purple levels) and the percentage of cells with the size of the dots.
