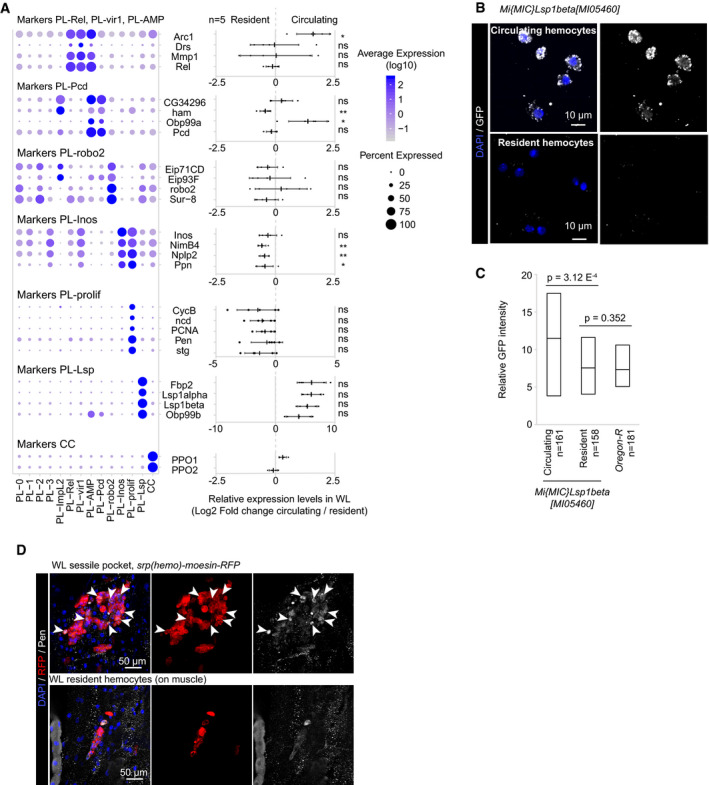
Figure 3. Localization of the NI hemocyte clusters.

- Identification of the position (circulating/resident) of the clusters within the larva by qPCR. The left panel indicates the distribution of each marker across all clusters (as in Fig 2D), and the right panel indicates the log2 of the ratio between the expression level in the circulating versus the resident compartment. Positive values indicate an enrichment in the circulating compartment and negative values in the resident compartment (n = 5, mean ± SD is represented on the graph). The P‐values are estimated by bilateral paired Student's t‐test and indicated as follow: ns = non‐significant (> 0.05), “*” = P[0.05–0.01[, “**” = P[0.01–0.001[.
- Circulating and resident hemocytes (top and bottom panels, respectively) from Mimic‐Lsp1beta‐MI05460 WL, which express Lsp1beta tagged with GFP. The immunolabeling was done using anti‐GFP (in gray), and the nuclei were marked with DAPI (blue). Full stacks are displayed, the left panels show the overlay of DAPI and GFP, and the right panels show the GFP alone. The scale bars represent 10 μm.
- Quantification of the GFP intensity in circulating and resident hemocytes from MiMIC‐Lsp1beta‐MI05460 larvae. The OregonR value indicates the background level. The number of cells included in the analysis is displayed on the x‐axis label and is quantified from two independent preparation; P‐values were estimated after variance analysis with bilateral student test for equal variance.
- Resident hemocytes located around the oenocytes or along the muscles (top and bottom panels, respectively) from WL srp(hemo)‐moesin‐RFP that express moesin tagged with RFP in hemocytes. The immunolabeling was done using anti‐RFP (in red) and anti‐pendulin (Pen, in gray), and the nuclei were marked with DAPI (blue). Full stacks are displayed; the left panels show the overlay of DAPI, Pen, and RFP; the middle panels show RFP alone; and the right panels show Pen alone. Arrowheads in the top panels indicate cells co‐expressing RFP and Pen. The scale bars represent 50 μm.
