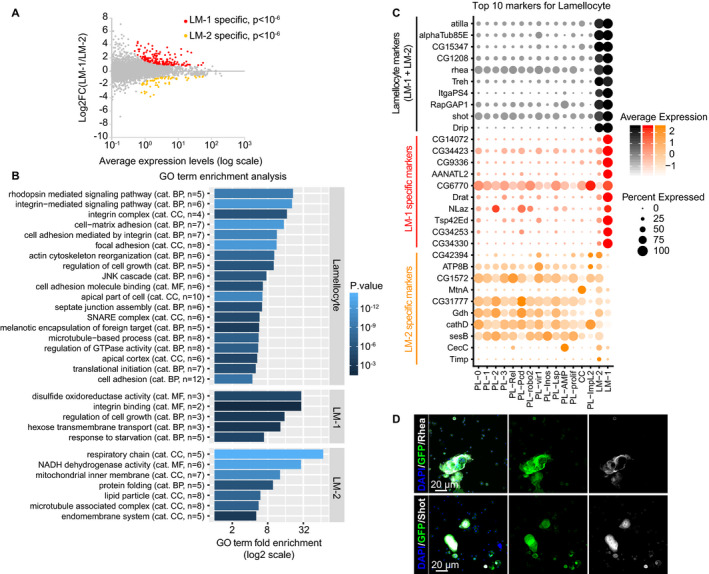
Figure 6. Characterization of the two lamellocyte clusters.

- Scatter plot comparing the transcriptome of the two lamellocyte clusters, deduced from the WI dataset. The x‐axis is the average expression levels of the genes and the y‐axis the log2 fold change (LM‐1/LM‐2). The genes significantly enriched in the LM‐1 cluster are highlighted in red (P < 10−6), those significantly enriched in the LM‐2 cluster in orange (P < 10−6).
- GO term enrichment analysis on the genes enriched in lamellocytes compared to all other clusters (top panel) and on the genes specific to LM‐1 (middle panel) or LM‐2 (lower panel). The bars represent the fold enrichment, and the color gradient indicates the P‐value of the GO term enrichment (as in Fig 2C).
- Expression levels (gradient of color) and the percentage of cells (size of the dots) for the top 10 markers of lamellocytes (in black), of markers specific to LM‐1 compared to LM‐2 (in red) and specific to LM‐2 compared to LM‐1 (in orange). Note that most markers enriched in LM‐1 compared to LM‐2 are exclusively expressed in LM‐1, while most markers enriched in LM‐2 compared to LM‐1 are also expressed in the plasmatocyte and crystal cell clusters.
- Hemocytes from WL OregonR infested by wasp. The immunolabeling was done with antibodies targeting the new lamellocyte markers identified in this study Rhea (in gray, top panels) and Shot (in gray, lower panels). Phalloidin‐FITC (in green) labels the actin filament particularly abundant in lamellocytes (Tokusumi et al, 2009), and the nuclei were marked with DAPI (blue). Full stacks are displayed; the left panels show the overlay of DAPI, FITC, and the lamellocyte markers; the middle panels show the FITC alone; and the right panels show the lamellocyte markers alone. The scale bars represent 20 μm.
