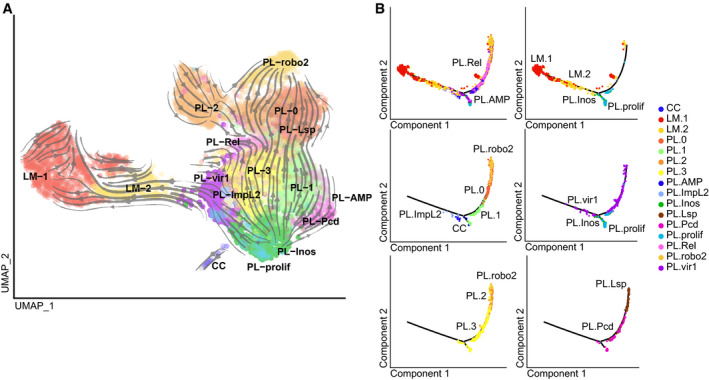
Figure 7. Identification of the filiation between the WI clusters.

- Lineage prediction for the clusters from the WI sample using RNA velocity, as in Fig 4C.
- Single‐cell trajectory reconstructed with Monocle 2 on the WI dataset. The panels show restricted number of clusters for which the RNA velocity analysis suggested a filiation.
