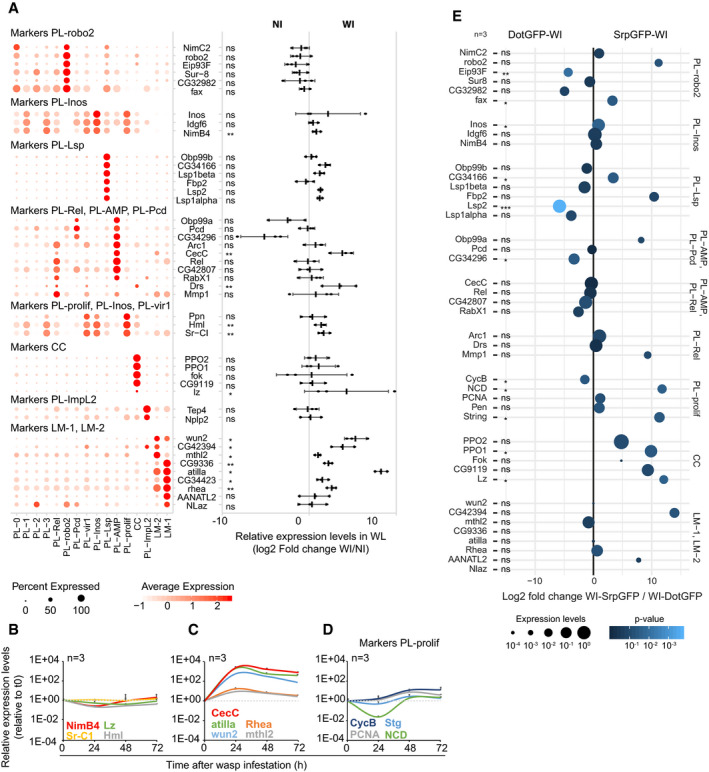
Figure 8. Timing of the production of the different clusters in the hemolymph of WI larvae.

-
AExpression levels of the cluster markers in the hemolymph of WI larvae compared to NI larvae. The left panel indicates the distribution of each marker across all clusters (as in Fig 2D), and the graph on the right panel indicates the log2 of the ratio between the expression level in WI versus NI. Positive values indicate an up‐regulation upon wasp infestation and negative values a down‐regulation (n = 3, pool of 10 larvae per replicate, mean ± SD is represented on the graph). The P‐value are estimated by bilateral Student's t‐test and indicated as follow: ns = non‐significant (> 0.05), “*” = P[0.05–0.01[, “**” = P[0.01–0.001[.
-
B, CExpression levels of the cluster markers increasing in WI compared to NI according to (A) during the progression of the immune response to wasp infestation. Collections were carried out at t0 (time of infestation, L2), 24 h (early L3), 48 h (mid L3), and 72 h (WL) after wasp infestation (n = 3). The timeline is on the x‐axis and the normalized expression levels on the y‐axis. The expression levels were normalized to the levels at t0. The dotted lines indicate t 0 relative level (=1). The markers that do not display strong variability during the timeline are presented in (B), and the ones showing a strong up‐regulation are in (C).
-
DExpression levels during the infestation timeline as in (B, C) for the markers of proliferation.
-
EWeighted dot plot representing the enrichment (log2 fold change) of the markers in hemocytes originating from the lymph gland (DotGFP‐WI) compared to embryonic hemocytes (srpGFP‐WI) from WI larva. The lymph gland hemocytes and embryonic hemocytes were traced using the lymph gland driver DotGal4 and the embryonic driver Srp(hemo)Gal4, respectively, combined with a lineage tracing construct. The relative expression levels are indicated by the size of the dots and the P‐value of the log2 fold change with the gradient dark blue (not significant) to light blue (P < 10−3). The P‐value is estimated by bilateral Student's t‐test and indicated as follow: ns = non‐significant (> 0.05), “*” = P[0.05–0.01[, “**” = P[0.01–0.001[, “***” = P < 0.001].
