-
A, B
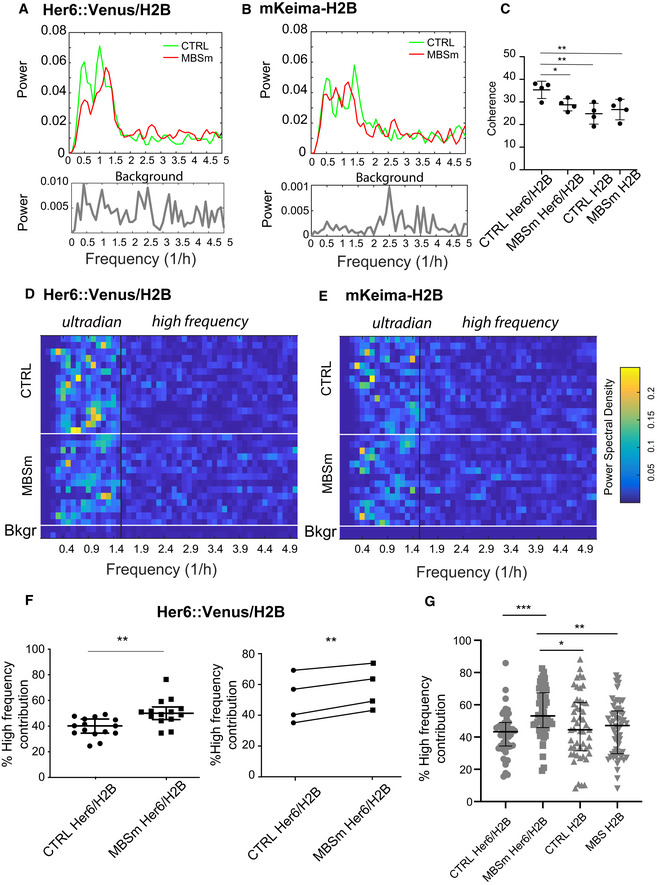
Representative example of power spectrum reconstruction showing corresponding data from Her6::Venus/H2B and mKeima‐H2B detrended time series collected from one control (CTRL) embryo and one miR‐9 binding site mutated (MBSm) embryo imaged simultaneously starting from 34 hpf; data represent aggregate power average of CTRL (15 cells, 1 embryo) and MBSm (14 cells, 1 embryo); power spectra from technical white noise labelled as Background show average of 2–3 timeseries collected in the absence of the fluorophore.
-
C
Comparative analysis of coherence values observed in CTRL and MBSm embryos using power spectrum analysis that includes examples in (A,B); dots indicate coherence per embryo calculated from 4 embryos per condition consisting of CTRL (15 cells, 5 cells, 13 cells, 7 cells; 4 embryos) and MBSm (14 cells, 5 + 12 cells, 4 + 8 cells, 13 cells; 6 embryos); bars indicate mean and SD; unpaired t‐test with two‐tailed significance for *P < 0.05, **P < 0.01.
-
D, E
Heatmap representation of single cell power spectral density (PSD) observed in Her6::Venus/H2B and mKeima‐H2B timeseries corresponding to aggregate measures included in (A and B); PSD of technical white noise labelled as Bkgr showing one timeseries per condition; vertical lines delineate ultradian periodicity from high frequency.
-
F
Left: Quantification of the contribution of high‐frequency noise to single cell PSD shown in (D, Her6::Venus/H2B); bars represent median and interquartile range of 14–15 cells per embryo per condition; statistical test represents Mann–Whitney with two‐tailed significance **P < 0.01. Right: Quantification of high‐frequency contribution with dots indicating median from 4 paired CTRL versus MBSm experiments with 1 embryo per condition (sample sizes stated in C); statistical tests indicate paired t‐test with two‐tailed significance **P < 0.01.
-
G
Pooled analysis of high‐frequency contribution quantified from Her6::Venus/H2B and H2B in CTRL (50 cells, 4 embryos) and MBSm (56 cells, 6 embryos) also including data shown in (F); bars indicate median with interquartile range; statistical tests indicate Kruskal–Wallis with Dunn's multiple comparison test with significance *P < 0.05, **P < 0.01, ***P < 0.001.

