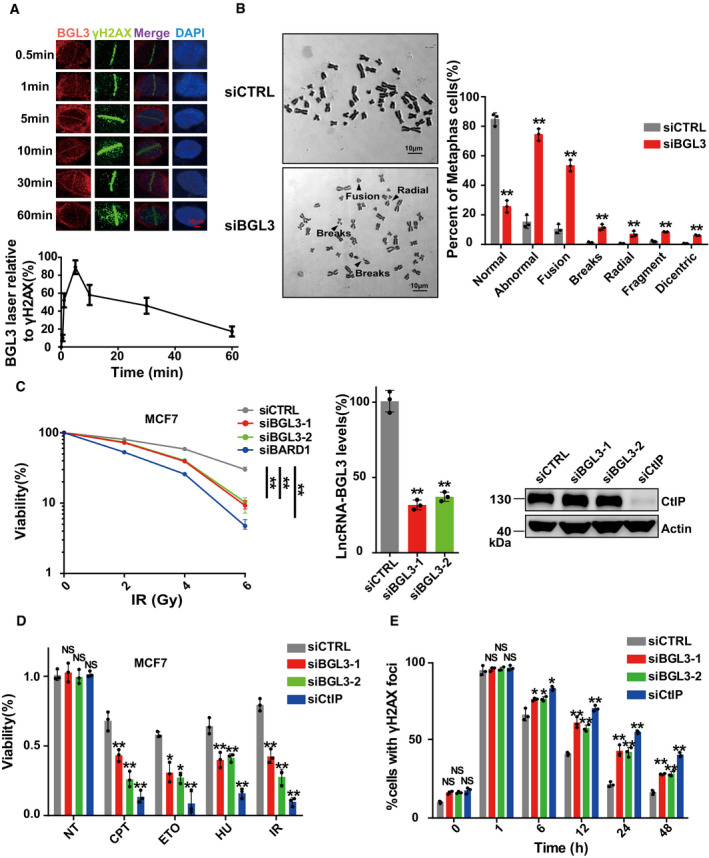
Figure 2. BGL3 is recruited to DNA damage sites and regulates genome stability.

- BGL3 is recruited to DNA damage sites. U2OS cells were subjected to laser micro‐irradiation to generate DSBs in a line pattern. The relocation kinetics of BGL3 to DSBs was monitored by RNA fluorescence in situ hybridization (FISH) in a time course as indicated. BGL3 intensities at the laser line were normalized into a numerical value using Nikon NIS‐Elements AR software (version 4.40.00). Data are presented as mean ± SD of four biological replicates.
- Chromosome aberrations induced by BGL3 depletion. Wild‐type or BGL3 depleted BJ‐5ta cells were used in the metaphase spread analysis for spontaneous DNA breaks. Representative image (left panel) and the percentage of cells containing at least one DNA break (right panel). Data are presented as mean ± SD of three biological replicates. Two‐tailed Student's t‐test, **P < 0.01.
- MCF‐7 cells were treated as indicated, and cell response to ionizing radiation was analyzed by colony formation assays (left panel). Data are presented as mean ± SEM of four independent experiments and analyzed by two‐way analysis of variance (ANOVA), **P < 0.01. Knockdown efficiency of BGL3 siRNA was examined by qRT–PCR and normalized to β‐actin (middle panel); data are presented as mean ± SD of three biological replicates. Two‐tailed Student's t‐test, **P < 0.01. Knockdown efficiency of CtIP siRNA was examined by blotting (right panel).
- MCF‐7 cells were transfected with the indicated siRNAs. Cell sensitivity to camptothecin (CPT), hydroxyurea (HU), etoposide (ETO), or ionizing radiation was determined by MTS assays. Data are presented as mean ± SD of three biological replicates. Two‐tailed Student's t‐test, *P < 0.05, **P < 0.01, NS: no significant difference.
- BGL3 deficiency inhibits DNA damage repair. Quantification of γ‐H2AX foci at indicated times after irradiation (2 Gy) is presented. Data shown are results of three independent experiments (100 cells for each experiment), presented as mean ± SD, two‐tailed Student's t‐test, *P < 0.05, **P < 0.01, NS: no significant difference.
Source data are available online for this figure.
