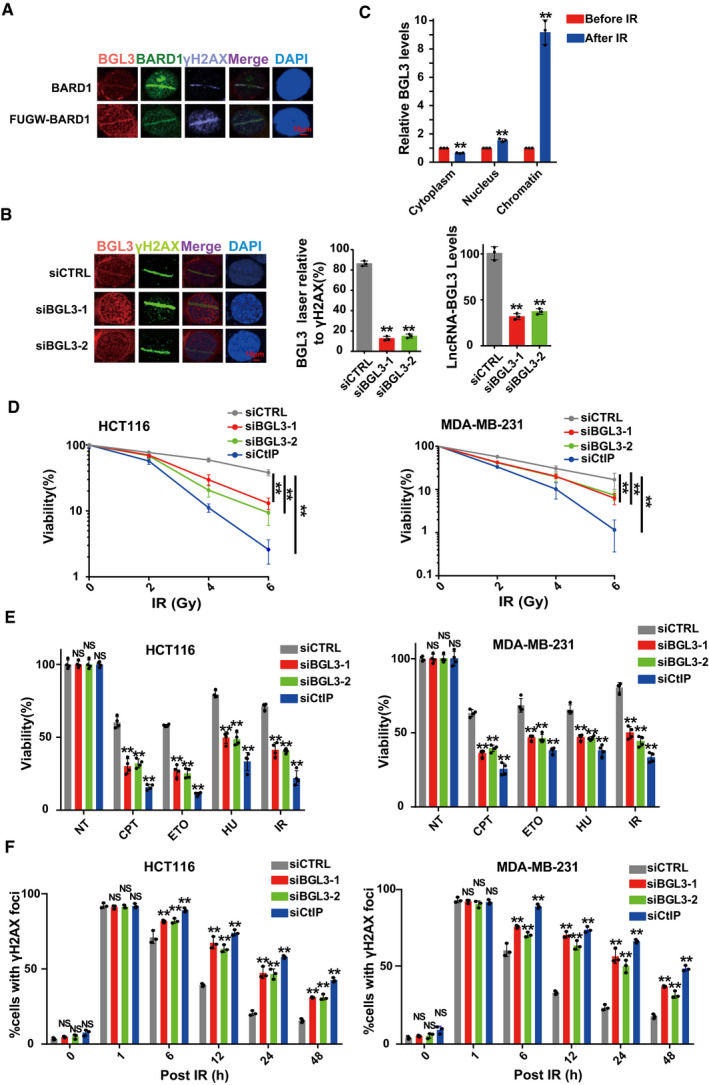
U2OS cells transfected with or without FUGW‐GFP‐BARD1 were subjected to laser micro‐irradiation to generate DSBs, and 10 min later, BGL3 and BARD1 recruitment was examined as described in the
Materials and Methods.
U2OS cells were transfected with the indicated siRNAs, and BGL3 (RNA FISH) and γ H2A.X (IF) recruitment to DNA damage sites was examined. Data shown are the average of three independent experiments (middle panel), and 100 cells were counted for each experiment, two‐tailed Student's t‐test, **P < 0.01. Knockdown efficiency of BGL3 siRNA was examined by qRT–PCR (right panel). Data are presented as mean ± SD of three independent experiments, two‐tailed Student's t‐test, **P < 0.01.
RT–qPCRs to examine the BGL3 RNA levels of cytosolic, nuclear, and chromatin fractions before and following 6 Gy IR in 293T cells. Data are presented as mean ± SD of three biological replicates, two‐tailed Student's t‐test, **P < 0.01.
HCT116 cells (left panel) and MDA‐MB‐231 cells (right panel) were treated as described in the
Materials and Methods section, and cell response to ionizing radiation (IR) was analyzed by colony formation assays. Data are presented as mean ± SEM of four independent experiments and analyzed by two‐way analysis of variance (ANOVA), **
P < 0.01.
HCT116 cells (left panel) and MDA‐MB‐231 cells (right panel) were transfected with the indicated siRNAs. Cell sensitivity to camptothecin (CPT), hydroxyurea (HU), etoposide (ETO), or IR was determined by MTS assays. Data were presented as mean ± SD of three biological replicates. Two‐tailed Student's t‐test, **P < 0.01, NS: no significant difference.
BGL3 deficiency inhibits DNA damage repair. HCT116 cells (left panel) and MDA‐MB‐231 cells (right panel) were transfected with the indicated siRNA. Quantification of γ‐H2AX foci at indicated times after irradiation (2 Gy) is presented. Data shown are results of three independent experiments (100 cells for each experiment), presented as mean ± SD, and analyzed by two‐tailed Student's t‐test, **P < 0.01, NS: no significant difference.

