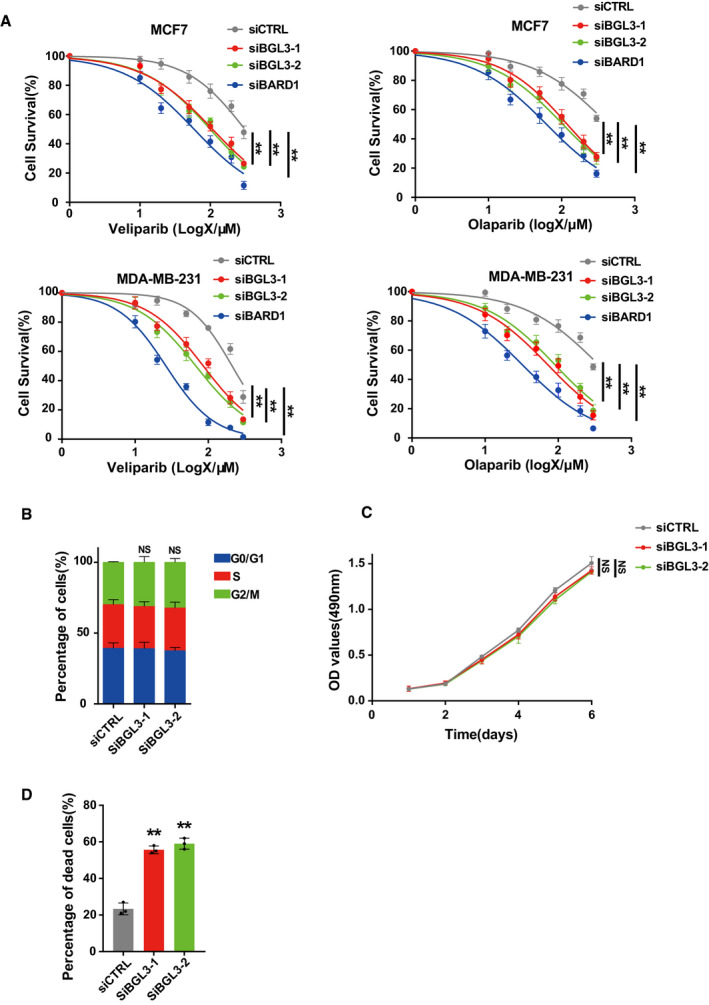
MCF7 cells (upper panel) and MDA‐MB‐231 cells (lower panel) were transfected with the indicated siRNA, and 48 h later, cell responses to the PARP inhibitors veliparib (left panel) or olaparib (right panel) were measured by MTS assay. Data are presented as mean ± SEM of three independent experiments and analyzed by two‐way analysis of variance (ANOVA), **P < 0.01.
Cell cycle profile of wild‐type or BGL3‐depleted U2OS cells. Data shown are averages of three independent experiments, presented as mean ± SD, NS: no significant difference.
Effects of BGL3 expression on cell growth. OD values of MCF7 cells expressing either control siRNA or different BGL3‐specific siRNAs were monitored for 6 days. Data are presented as mean ± SEM of four independent experiments and analyzed by two‐way analysis of variance (ANOVA), NS: no significant difference.
MCF7 cells were transfected with the indicated siRNA. Quantification of dead cells at 12 h after irradiation (6 Gy) is presented. Data shown are results from three independent experiments, presented as mean ± SD, and analyzed by two‐tailed Student's t‐test, **P < 0.01

